How To Use Traefik v2 as a Reverse Proxy for Docker Containers on Ubuntu 20.04

Introduction

Docker can be an efficient way to run web applications in production, but you may want to run multiple applications on the same Docker host. In this situation, you’ll need to set up a reverse proxy. This is because you only want to expose ports 80 and 443 to the rest of the world.

Traefik is a Docker-aware reverse proxy that includes a monitoring dashboard. Traefik v1 has been widely used for a while, and you can follow this earlier tutorial to install Traefik v1). But in this tutorial, you’ll install and configure Traefik v2, which includes quite a few differences.

The biggest difference between Traefik v1 and v2 is that frontends and backends were removed and their combined functionality spread out across routersmiddlewares, and services. Previously a backend did the job of making modifications to requests and getting that request to whatever was supposed to handle it. Traefik v2 provides more separation of concerns by introducing middlewares that can modify requests before sending them to a service. Middlewares make it easier to specify a single modification step that might be used by a lot of different routes so that they can be reused (such as HTTP Basic Auth, which you’ll see later). A router can also use many different middlewares.

In this tutorial you’ll configure Traefik v2 to route requests to two different web application containers: a WordPress container and an Adminer container, each talking to a MySQL database. You’ll configure Traefik to serve everything over HTTPS using Let’s Encrypt.

Prerequisites

To complete this tutorial, you will need the following:

      • One Ubuntu 20.04 server with a sudo non-root user and a firewall. You can set this up by following your Ubuntu 20.04 initial server setup guide.
      • Docker installed on your server, which you can accomplish by following Steps 1 and 2 of How to Install and Use Docker on Ubuntu 20.04.
      • Docker Compose installed using the instructions from Step 1 of How to Install Docker Compose on Ubuntu 20.04.
      • A domain and three A records, db-admin.your_domainblog.your_domain and monitor.your_domain. Each should point to the IP address of your server. You can learn how to point domains to DigitalOcean Droplets by reading through DigitalOcean’s Domains and DNS documentation. Throughout this tutorial, substitute your domain for your_domain in the configuration files and examples.

        Step 1 — Configuring and Running Traefik

        The Traefik project has an official Docker image, so you will use that to run Traefik in a Docker container.

        But before you get your Traefik container up and running, you need to create a configuration file and set up an encrypted password so you can access the monitoring dashboard.

        You’ll use the htpasswd utility to create this encrypted password. First, install the utility, which is included in the apache2-utils package:

         $ sudo apt-get install apache2-utils

        The output from the program will look like this:

        Output
        admin:$apr1$ruca84Hq$mbjdMZBAG.KWn7vfN/SNK/

        Youu’ll use this output in the Traefik configuration file to set up HTTP Basic Authentication for the Traefik health check and monitoring dashboard. Copy the entire output line so you can paste it later.

        To configure the Traefik server, you’ll create two new configuration files called traefik.toml and traefik_dynamic.toml using the TOML format. TOML is a configuration language similar to INI files, but standardized. These files let us configure the Traefik server and various integrations, or providers, that you want to use. In this tutorial, you will use three of Traefik’s available providers: api, docker, and acme. The last of these, acme, supports TLS certificates using Let’s Encrypt.

        Create and open traefik.toml using nano or your preferred text editor:

         $ nano traefik.toml

        First, you want to specify the ports that Traefik should listen on using the entryPoints section of your config file. You want two because you want to listen on port 80 and 443. Let’s call these web (port 80) and websecure (port 443).

        Add the following configurations:>

        traefik.toml
        [entryPoints]
          [entryPoints.web]
            address = ":80"
            [entryPoints.web.http.redirections.entryPoint]
              to = "websecure"
              scheme = "https"
        
          [entryPoints.websecure]
            address = ":443"

    Note that you are also automatically redirecting traffic to be handled over TLS.

    Next, configure the Traefik api, which gives you access to both the API and your dashboard interface. The heading of [api] is all that you need because the dashboard is then enabled by default, but you’ll be explicit for the time being.

    Add the following code:

    traefik.toml
    ...
    [api]
      dashboard = true

    To finish securing your web requests you want to use Let’s Encrypt to generate valid TLS certificates. Traefik v2 supports Let’s Encrypt out of the box and you can configure it by creating a certificates resolver of the type acme.

    Let’s configure your certificates resolver now using the name lets-encrypt:

    traefik.toml
    ...
    [certificatesResolvers.lets-encrypt.acme]
      email = "your_email@your_domain"
      storage = "acme.json"
      [certificatesResolvers.lets-encrypt.acme.tlsChallenge]

    This section is called acme because ACME is the name of the protocol used to communicate with Let’s Encrypt to manage certificates. The Let’s Encrypt service requires registration with a valid email address, so to have Traefik generate certificates for your hosts, set the email key to your email address. You then specify that you will store the information that you will receive from Let’s Encrypt in a JSON file called acme.json.

    The acme.tlsChallenge section allows us to specify how Let’s Encrypt can verify that the certificate. You’re configuring it to serve a file as part of the challenge over port 443.

    Finally, you need to configure Traefik to work with Docker.

    Add the following configurations:

    traefik.toml
    ...
    [providers.docker]
      watch = true
      network = "web"

    The docker provider enables Traefik to act as a proxy in front of Docker containers. You’ve configured the provider to watch for new containers on the web network, which you’ll create soon.

    Our final configuration uses the file provider. With Traefik v2, static and dynamic configurations can’t be mixed and matched. To get around this, you will use traefik.toml to define your static configurations and then keep your dynamic configurations in another file, which you will call traefik_dynamic.toml. Here you are using the file provider to tell Traefik that it should read in dynamic configurations from a different file.

    Add the following file provider:

    traefik.toml
     $ providers.file
     $ filename = "traefik_dynamic.toml"

    Your completed traefik.toml will look like this:

    traefik.toml
    [entryPoints]
      [entryPoints.web]
        address = ":80"
        [entryPoints.web.http.redirections.entryPoint]
          to = "websecure"
          scheme = "https"
    
      [entryPoints.websecure]
        address = ":443"
    
    [api]
      dashboard = true
    
    [certificatesResolvers.lets-encrypt.acme]
      email = "your_email@your_domain"
      storage = "acme.json"
      [certificatesResolvers.lets-encrypt.acme.tlsChallenge]
    
    [providers.docker]
      watch = true
      network = "web"
    
    [providers.file]
      filename = "traefik_dynamic.toml"

    Save and close the file.

    Now let’s create traefik_dynamic.toml.

    The dynamic configuration values that you need to keep in their own file are the middlewares and the routers. To put your dashboard behind a password you need to customize the API’s router and configure a middleware to handle HTTP basic authentication. Let’s start by setting up the middleware.

    The middleware is configured on a per-protocol basis and since you’re working with HTTP you’ll specify it as a section chained off of http.middlewares. Next comes the name of your middleware so that you can reference it later, followed by the type of middleware that it is, which will be basicAuth in this case. Let’s call your middleware simpleAuth.

    Create and open a new file called traefik_dynamic.toml:

     $ nano traefik_dynamic.toml

    Add the following code. This is where you’ll paste the output from the htpasswd command:

    traefik_dynamic.toml
    [http.middlewares.simpleAuth.basicAuth]
      users = [
        "admin:$apr1$ruca84Hq$mbjdMZBAG.KWn7vfN/SNK/"
      ]

    To configure the router for the api you’ll once again be chaining off of the protocol name, but instead of using http.middlewares, you’ll use http.routers followed by the name of the router. In this case, the api provides its own named router that you can configure by using the [http.routers.api] section. You’ll configure the domain that you plan on using with your dashboard also by setting the rule key using a host match, the entrypoint to use websecure, and the middlewares to include simpleAuth.

    Add the following configurations:

    traefik_dynamic.toml
    ...
    [http.routers.api]
      rule = "Host(`monitor.your_domain`)"
      entrypoints = ["websecure"]
      middlewares = ["simpleAuth"]
      service = "api@internal"
      [http.routers.api.tls]
        certResolver = "lets-encrypt"

    The web entry point handles port 80, while the websecure entry point uses port 443 for TLS/SSL. You automatically redirect all of the traffic on port 80 to the websecure entry point to force secure connections for all requests.

    Notice the last three lines here configure a service, enable tls, and configure certResolver to “lets-encrypt”. Services are the final step to determining where a request is finally handled. The api@internal service is a built-in service that sits behind the API that you expose. Just like routers and middlewares, services can be configured in this file, but you won’t need to do that to achieve your desired result.

    Your completed traefik_dynamic.toml file will look like this:

    traefik_dynamic.toml
    [http.middlewares.simpleAuth.basicAuth]
      users = [
        "admin:$apr1$ruca84Hq$mbjdMZBAG.KWn7vfN/SNK/"
      ]
    
    [http.routers.api]
      rule = "Host(`monitor.your_domain`)"
      entrypoints = ["websecure"]
      middlewares = ["simpleAuth"]
      service = "api@internal"
      [http.routers.api.tls]
        certResolver = "lets-encrypt"

    Save the file and exit the editor.

    With these configurations in place, you will now start Traefik

    Step 2 – Running the Traefik Container

    In this step you will create a Docker network for the proxy to share with containers. You will then access the Traefik dashboard. The Docker network is necessary so that you can use it with applications that are run using Docker Compose.

    Create a new Docker network called web:

     $ docker network create web

    When the Traefik container starts, you will add it to this network. Then you can add additional containers to this network later for Traefik to proxy to.

    Next, create an empty file that will hold your Let’s Encrypt information. You’ll share this into the container so Traefik can use it:

     $ touch acme.json

    Traefik will only be able to use this file if the root user inside of the container has unique read and write access to it. To do this, lock down the permissions on acme.json so that only the owner of the file has read and write permission.

     $ chmod 600 acme.json

    Once the file gets passed to Docker, the owner will automatically change to the root user inside the container.

    Finally, create the Traefik container with this command:

     $ docker run -d \
    $ -v /var/run/docker.sock:/var/run/docker.sock \
    $ -v $PWD/traefik.toml:/traefik.toml \
    $ -v $PWD/traefik_dynamic.toml:/traefik_dynamic.toml \
    $ -v $PWD/acme.json:/acme.json \
    $ -p 80:80 \
    $ -p 443:443 \
    $ --network web \
    $ --name traefik \
    $ traefik:v2.2
    

    This command is a little long. Let’s break it down.

    You use the -d flag to run the container in the background as a daemon. You then share your docker.sock file into the container so that the Traefik process can listen for changes to containers. You also share the traefik.toml and traefik_dynamic.toml configuration files into the container, as well as acme.json.

    Next, you map ports :80 and :443 of your Docker host to the same ports in the Traefik container so Traefik receives all HTTP and HTTPS traffic to the server.

    You set the network of the container to web, and you name the container traefik.

    Finally, you use the traefik:v2.2 image for this container so that you can guarantee that you’re not running a completely different version than this tutorial is written for.

    A Docker image’s ENTRYPOINT is a command that always runs when a container is created from the image. In this case, the command is the traefik binary within the container. You can pass additional arguments to that command when you launch the container, but you’ve configured all of your settings in the traefik.toml file.

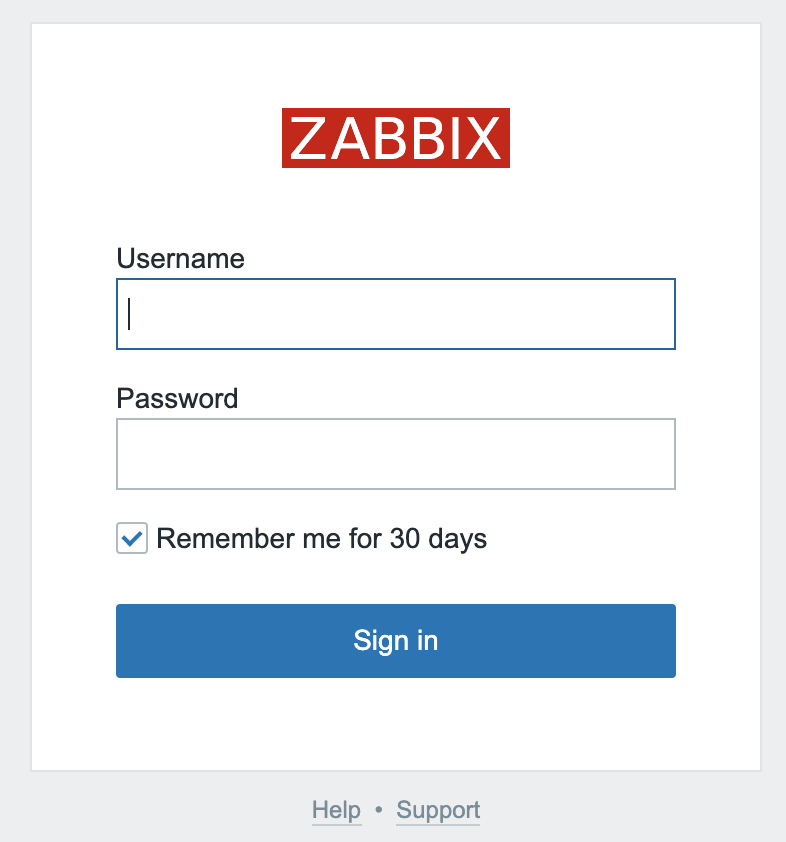
    With the container started, you now have a dashboard you can access to see the health of your containers. You can also use this dashboard to visualize the routers, services, and middlewares that Traefik has registered. You can try to access the monitoring dashboard by pointing your browser to https://monitor.your_domain/dashboard/ (the trailing / is required).

    You will be prompted for your username and password, which are admin and the password you configured in Step 1.

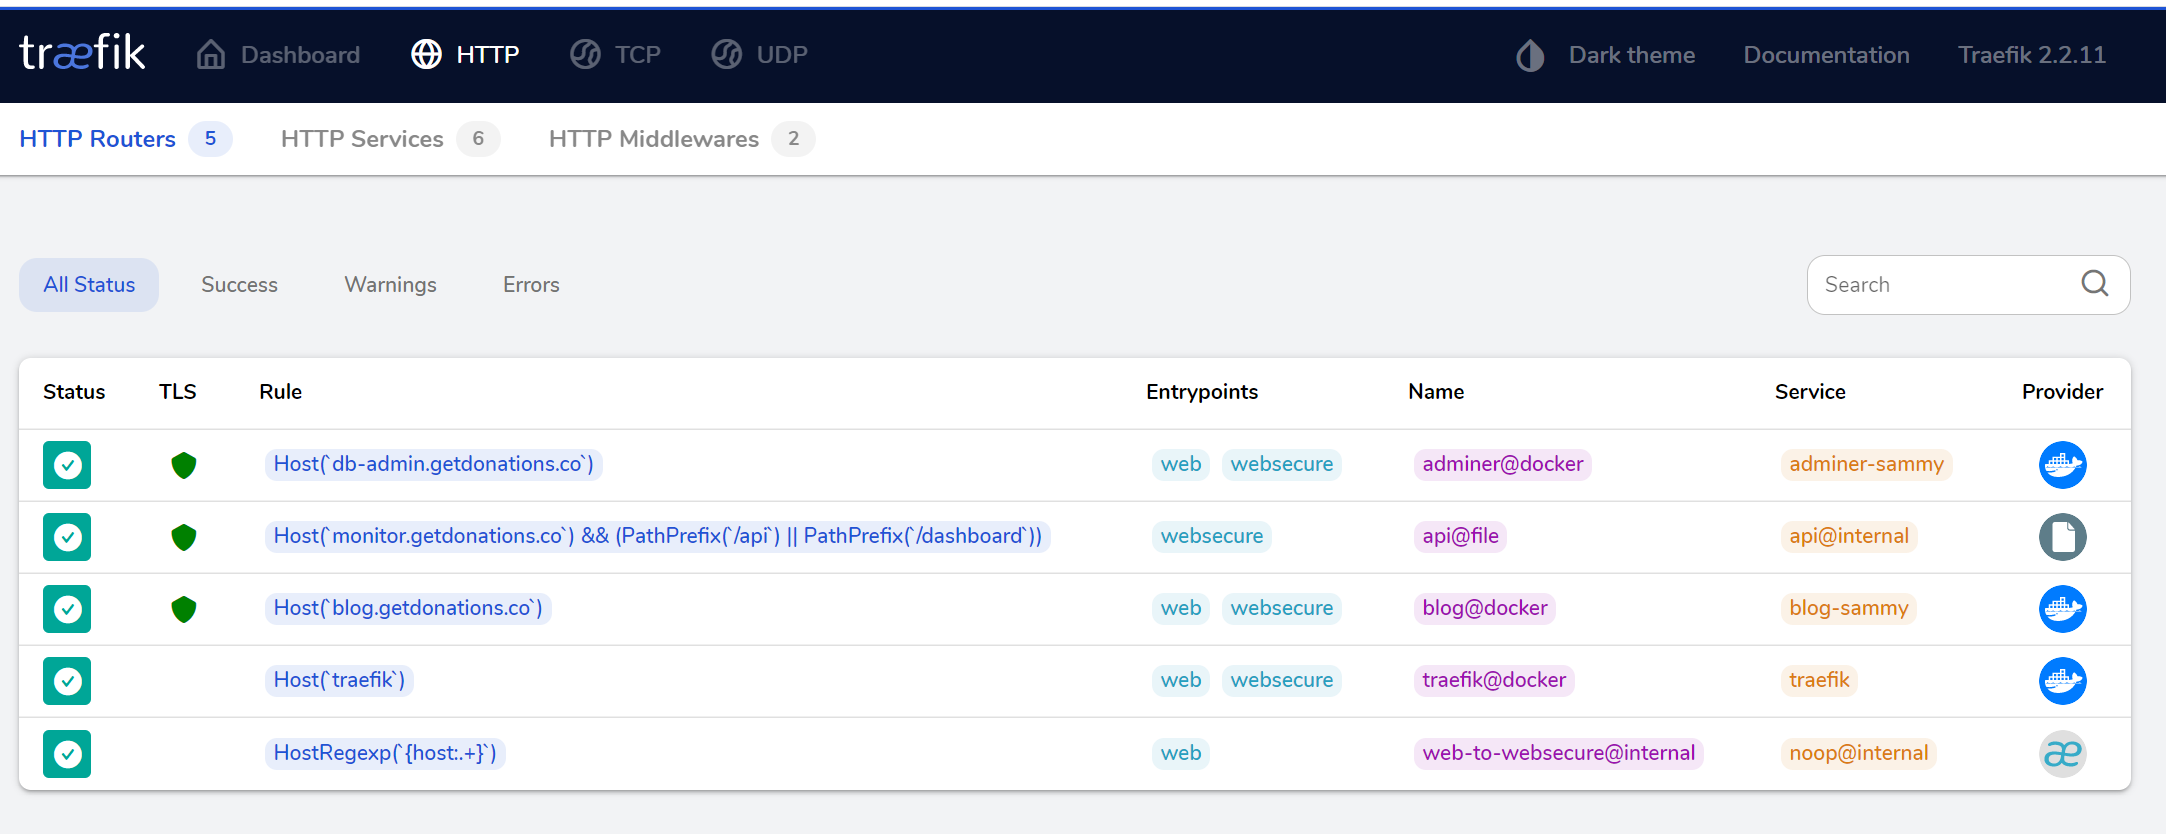
    Once logged in, you’ll see the Traefik interface:

    Empty Traefik dashboard

    You will notice that there are already some routers and services registered, but those are the ones that come with Traefik and the router configuration that you wrote for the API.

    You now have your Traefik proxy running, and you’ve configured it to work with Docker and monitor other containers. In the next step you will start some containers for Traefik to proxy.

    Step 3 — Registering Containers with Traefik
    With the Traefik container running, you’re ready to run applications behind it. Let’s launch the following containers behind Traefik:

    A blog using the official WordPress image.
    A database management server using the official Adminer image.
    You’ll manage both of these applications with Docker Compose using a docker-compose.yml file.

    Create and open the docker-compose.yml file in your editor:

     $ nano docker-compose.yml

    Add the following lines to the file to specify the version and the networks you’ll use:

    docker-compose.yml
    version: "3"
    
    networks:
      web:
        external: true
      internal:
        external: false

    You use Docker Compose version 3 because it’s the newest major version of the Compose file format.

    For Traefik to recognize your applications, they must be part of the same network, and since you created the network manually, you pull it in by specifying the network name of web and setting external to true. Then you define another network so that you can connect your exposed containers to a database container that you won’t expose through Traefik. You’ll call this network internal.

    Next, you’ll define each of your services, one at a time. Let’s start with the blog container, which you’ll base on the official WordPress image. Add this configuration to the bottom of the file:

    docker-compose.yml
    ...
    
    services:
      blog:
        image: wordpress:4.9.8-apache
        environment:
          WORDPRESS_DB_PASSWORD:
        labels:
          - traefik.http.routers.blog.rule=Host(`blog.your_domain`)
          - traefik.http.routers.blog.tls=true
          - traefik.http.routers.blog.tls.certresolver=lets-encrypt
          - traefik.port=80
        networks:
          - internal
          - web
        depends_on:
          - mysql

    The environment key lets you specify environment variables that will be set inside of the container. By not setting a value for WORDPRESS_DB_PASSWORD, you’re telling Docker Compose to get the value from your shell and pass it through when you create the container. You will define this environment variable in your shell before starting the containers. This way you don’t hard-code passwords into the configuration file.

    The labels section is where you specify configuration values for Traefik. Docker labels don’t do anything by themselves, but Traefik reads these so it knows how to treat containers. Here’s what each of these labels does:

    traefik.http.routers.adminer.rule=Host(`blog.your_domain`) creates a new router for your container and then specifies the routing rule used to determine if a request matches this container.
    traefik.routers.custom_name.tls=true specifies that this router should use TLS.
    traefik.routers.custom_name.tls.certResolver=lets-encrypt specifies that the certificates resolver that you created earlier called lets-encrypt should be used to get a certificate for this route.
    traefik.port specifies the exposed port that Traefik should use to route traffic to this container.
    With this configuration, all traffic sent to your Docker host on port 80 or 443 with the domain of blog.your_domain will be routed to the blog container.

    You assign this container to two different networks so that Traefik can find it via the web network and it can communicate with the database container through the internal network.

    Lastly, the depends_on key tells Docker Compose that this container needs to start after its dependencies are running. Since WordPress needs a database to run, you must run your mysql container before starting your blog container.

    Next, configure the MySQL service:

    docker-compose.yml
    services:
    ...
      mysql:
        image: mysql:5.7
        environment:
          MYSQL_ROOT_PASSWORD:
        networks:
          - internal
        labels:
          - traefik.enable=false

    You’re using the official MySQL 5.7 image for this container. You’ll notice that you’re once again using an environment item without a value. The MYSQL_ROOT_PASSWORD and WORDPRESS_DB_PASSWORD variables will need to be set to the same value to make sure that your WordPress container can communicate with the MySQL. You don’t want to expose the mysql container to Traefik or the outside world, so you’re only assigning this container to the internal network. Since Traefik has access to the Docker socket, the process will still expose a router for the mysql container by default, so you’ll add the label traefik.enable=false to specify that Traefik should not expose this container.

    Finally, define the Adminer container:

    docker-compose.yml
    services:
    ...
      adminer:
        image: adminer:4.6.3-standalone
        labels:
          - traefik.http.routers.adminer.rule=Host(`db-admin.your_domain`)
          - traefik.http.routers.adminer.tls=true
          - traefik.http.routers.adminer.tls.certresolver=lets-encrypt
          - traefik.port=8080
        networks:
          - internal
          - web
        depends_on:
          - mysql

    This container is based on the official Adminer image. The network and depends_on configuration for this container exactly match what you’re using for the blog container.

    The line traefik.http.routers.adminer.rule=Host(`db-admin.your_domain`) tells Traefik to examine the host requested. If it matches the pattern of db-admin.your_domain, Traefik will route the traffic to the adminer container over port 8080.

    Your completed docker-compose.yml file will look like this:

    docker-compose.yml
    version: "3"
    
    networks:
      web:
        external: true
      internal:
        external: false
    
    services:
      blog:
        image: wordpress:4.9.8-apache
        environment:
          WORDPRESS_DB_PASSWORD:
        labels:
          - traefik.http.routers.blog.rule=Host(`blog.your_domain`)
          - traefik.http.routers.blog.tls=true
          - traefik.http.routers.blog.tls.certresolver=lets-encrypt
          - traefik.port=80
        networks:
          - internal
          - web
        depends_on:
          - mysql
    
      mysql:
        image: mysql:5.7
        environment:
          MYSQL_ROOT_PASSWORD:
        networks:
          - internal
        labels:
          - traefik.enable=false
    
      adminer:
        image: adminer:4.6.3-standalone
        labels:
        labels:
          - traefik.http.routers.adminer.rule=Host(`db-admin.your_domain`)
          - traefik.http.routers.adminer.tls=true
          - traefik.http.routers.adminer.tls.certresolver=lets-encrypt
          - traefik.port=8080
        networks:
          - internal
          - web
        depends_on:
          - mysql

    Save the file and exit the text editor.

    Next, set values in your shell for the WORDPRESS_DB_PASSWORD and MYSQL_ROOT_PASSWORD variables:

    $ export WORDPRESS_DB_PASSWORD=secure_database_password
    $ export MYSQL_ROOT_PASSWORD=secure_database_password
    

    Substitute secure_database_password with your desired database password. Remember to use the same password for both WORDPRESS_DB_PASSWORD and MYSQL_ROOT_PASSWORD.

    With these variables set, run the containers using docker-compose:

     $ docker-compose up -d

    Now watch the Traefik admin dashboard while it populates.

    Populated Traefik dashboard

    If you explore the Routers section you will find routers for adminer and blog configured with TLS:

    HTTP Routers w/ TLS

    Navigate to blog.your_domain, substituting your_domain with your domain. You’ll be redirected to a TLS connection and you can now complete the WordPress setup:

    WordPress setup screen

    Now access Adminer by visiting db-admin.your_domain in your browser, again substituting your_domain with your domain. The mysql container isn’t exposed to the outside world, but the adminer container has access to it through the internal Docker network that they share using the mysql container name as a hostname.

    On the Adminer login screen, enter root for Username, enter mysql for Server, and enter the value you set for MYSQL_ROOT_PASSWORD for the Password. Leave Database empty. Now press Login.

    Once logged in, you’ll see the Adminer user interface.

    Adminer connected to the MySQL database

    Both sites are now working, and you can use the dashboard at monitor.your_domain to keep an eye on your applications.

    Conclusion
    In this tutorial, you configured Traefik v2 to proxy requests to other applications in Docker containers.

    Traefik’s declarative configuration at the application container level makes it easy to configure more services, and there’s no need to restart the traefik container when you add new applications to proxy traffic to since Traefik notices the changes immediately through the Docker socket file it’s monitoring.

    To learn more about what you can do with Traefik v2, head over to the official Traefik documentation.

How To Serve Flask Applications with Gunicorn and Nginx on Ubuntu 20.04

Introduction
In this guide, you will build a Python application using the Flask microframework on Ubuntu 20.04. The bulk of this article will be about how to set up the Gunicorn application server and how to launch the application and configure Nginx to act as a front-end reverse proxy.

Before starting this guide, you should have:

  • A server with Ubuntu 20.04 installed and a non-root user with sudo privileges. Follow our initial server setup guide for guidance.
  • Nginx installed, following Steps 1 and 2 of How To Install Nginx on Ubuntu 20.04.
  • A domain name configured to point to your server. You can purchase one on Namecheap or get one for free on Freenom. You can learn how to point domains to DigitalOcean by following the relevant documentation on domains and DNS. Be sure to create the following DNS records:
    • An A record with your_domain pointing to your server’s public IP address.
    • An A record with www.your_domain pointing to your server’s public IP address.
  • Familiarity with the WSGI specification, which the Gunicorn server will use to communicate with your Flask application. This discussion covers WSGI in more detail.

Step 1 — Installing the Components from the Ubuntu Repositories

Our first step will be to install all of the pieces we need from the Ubuntu repositories. This includes pip, the Python package manager, which will manage our Python components. We will also get the Python development files necessary to build some of the Gunicorn components.

First, let’s update the local package index and install the packages that will allow us to build our Python environment. These will include python3-pip, along with a few more packages and development tools necessary for a robust programming environment:

 $ sudo apt update
 $ sudo apt install python3-pip python3-dev build-essential libssl-dev libffi-dev python3-setuptools

With these packages in place, let’s move on to creating a virtual environment for our project.

Next, we’ll set up a virtual environment in order to isolate our Flask application from the other Python files on the system.

Start by installing the python3-venv package, which will install the venv module:

sudo apt install python3-venv

Next, let’s make a parent directory for our Flask project. Move into the directory after you create it:

  • mkdir ~/myproject
  • cd ~/myproject

Create a virtual environment to store your Flask project’s Python requirements by typing:

  • python3 -m venv myprojectenv

This will install a local copy of Python and pip into a directory called myprojectenv within your project directory.

Before installing applications within the virtual environment, you need to activate it. Do so by typing:

  • source myprojectenv/bin/activate

Your prompt will change to indicate that you are now operating within the virtual environment. It will look something like this: (myprojectenv)user@host:~/myproject$.

Now that you are in your virtual environment, you can install Flask and Gunicorn and get started on designing your application.

First, let’s install wheel with the local instance of pip to ensure that our packages will install even if they are missing wheel archives:

  • pip install wheel


Note

Regardless of which version of Python you are using, when the virtual environment is activated, you should use the pip command (not pip3).


Next, let’s install Flask and Gunicorn:

  • pip install gunicorn flask

Creating a Sample App

Now that you have Flask available, you can create a simple application. Flask is a microframework. It does not include many of the tools that more full-featured frameworks might, and exists mainly as a module that you can import into your projects to assist you in initializing a web application.

While your application might be more complex, we’ll create our Flask app in a single file, called myproject.py:

  • nano ~/myproject/myproject.py

The application code will live in this file. It will import Flask and instantiate a Flask object. You can use this to define the functions that should be run when a specific route is requested:

~/myproject/myproject.py
from flask import Flask
app = Flask(__name__)

@app.route("/")
def hello():
    return "<h1 style='color:blue'>Hello There!</h1>"

if __name__ == "__main__":
    app.run(host='0.0.0.0')

This basically defines what content to present when the root domain is accessed. Save and close the file when you’re finished.

If you followed the initial server setup guide, you should have a UFW firewall enabled. To test the application, you need to allow access to port 5000:

 $ sudo ufw allow 5000

Now you can test your Flask app by typing:

  • python myproject.py

You will see output like the following, including a helpful warning reminding you not to use this server setup in production:

Output
* Serving Flask app "myproject" (lazy loading)
 * Environment: production
   WARNING: Do not use the development server in a production environment.
   Use a production WSGI server instead.
 * Debug mode: off
 * Running on http://0.0.0.0:5000/ (Press CTRL+C to quit)

Visit your server’s IP address followed by :5000 in your web browser:

http://your_server_ip:5000

You should see something like this:

Flask sample app

When you are finished, hit CTRL-C in your terminal window to stop the Flask development server.

Creating the WSGI Entry Point

Next, let’s create a file that will serve as the entry point for our application. This will tell our Gunicorn server how to interact with the application.

Let’s call the file wsgi.py:

  • nano ~/myproject/wsgi.py

In this file, let’s import the Flask instance from our application and then run it:

~/myproject/wsgi.py
from myproject import app

if __name__ == "__main__":
    app.run()

Save and close the file when you are finished.

Your application is now written with an entry point established. We can now move on to configuring Gunicorn.

Before moving on, we should check that Gunicorn can serve the application correctly.

We can do this by simply passing it the name of our entry point. This is constructed as the name of the module (minus the .py extension), plus the name of the callable within the application. In our case, this is wsgi:app.

We’ll also specify the interface and port to bind to so that the application will be started on a publicly available interface:

  • cd ~/myproject
  • gunicorn –bind 0.0.0.0:5000 wsgi:app

You should see output like the following:

Output
[2020-05-20 14:13:00 +0000] [46419] [INFO] Starting gunicorn 20.0.4
[2020-05-20 14:13:00 +0000] [46419] [INFO] Listening at: http://0.0.0.0:5000 (46419)
[2020-05-20 14:13:00 +0000] [46419] [INFO] Using worker: sync
[2020-05-20 14:13:00 +0000] [46421] [INFO] Booting worker with pid: 46421

Visit your server’s IP address with :5000 appended to the end in your web browser again:

http://your_server_ip:5000

You should see your application’s output:

Flask sample app

When you have confirmed that it’s functioning properly, press CTRL-C in your terminal window.

We’re now done with our virtual environment, so we can deactivate it:

  • deactivate

Any Python commands will now use the system’s Python environment again.

Next, let’s create the systemd service unit file. Creating a systemd unit file will allow Ubuntu’s init system to automatically start Gunicorn and serve the Flask application whenever the server boots.

Create a unit file ending in .service within the /etc/systemd/system directory to begin:

 $ sudo nano /etc/systemd/system/myproject

Inside, we’ll start with the [Unit] section, which is used to specify metadata and dependencies. Let’s put a description of our service here and tell the init system to only start this after the networking target has been reached:

/etc/systemd/system/myproject.service
[Unit]
Description=Gunicorn instance to serve myproject
After=network.target

Next, let’s open up the [Service] section. This will specify the user and group that we want the process to run under. Let’s give our regular user account ownership of the process since it owns all of the relevant files. Let’s also give group ownership to the www-data group so that Nginx can communicate easily with the Gunicorn processes. Remember to replace the username here with your username:

/etc/systemd/system/myproject.service
[Unit]
Description=Gunicorn instance to serve myproject
After=network.target

[Service]
User=sammy
Group=www-data

Next, let’s map out the working directory and set the PATH environmental variable so that the init system knows that the executables for the process are located within our virtual environment. Let’s also specify the command to start the service. This command will do the following:

  • Start 3 worker processes (though you should adjust this as necessary)
  • Create and bind to a Unix socket file, myproject.sock, within our project directory. We’ll set an umask value of 007 so that the socket file is created giving access to the owner and group, while restricting other access
  • Specify the WSGI entry point file name, along with the Python callable within that file (wsgi:app)

Systemd requires that we give the full path to the Gunicorn executable, which is installed within our virtual environment.

Remember to replace the username and project paths with your own information:

/etc/systemd/system/myproject.service
[Unit]
Description=Gunicorn instance to serve myproject
After=network.target

[Service]
User=sammy
Group=www-data
WorkingDirectory=/home/sammy/myproject
Environment="PATH=/home/sammy/myproject/myprojectenv/bin"
ExecStart=/home/sammy/myproject/myprojectenv/bin/gunicorn --workers 3 --bind unix:myproject.sock -m 007 wsgi:app

Finally, let’s add an [Install] section. This will tell systemd what to link this service to if we enable it to start at boot. We want this service to start when the regular multi-user system is up and running:

/etc/systemd/system/myproject.service
[Unit]
Description=Gunicorn instance to serve myproject
After=network.target

[Service]
User=sammy
Group=www-data
WorkingDirectory=/home/sammy/myproject
Environment="PATH=/home/sammy/myproject/myprojectenv/bin"
ExecStart=/home/sammy/myproject/myprojectenv/bin/gunicorn --workers 3 --bind unix:myproject.sock -m 007 wsgi:app

[Install]
WantedBy=multi-user.target

With that, our systemd service file is complete. Save and close it now.

We can now start the Gunicorn service we created and enable it so that it starts at boot:

 $ sudo systemctl start myproject
 $ sudo systemctl enable myproject

Let’s check the status:

 $ sudo systemctl status myproject

You should see output like this:

Output
● myproject.service - Gunicorn instance to serve myproject
     Loaded: loaded (/etc/systemd/system/myproject.service; enabled; vendor preset: enabled)
     Active: active (running) since Wed 2020-05-20 14:15:18 UTC; 1s ago
   Main PID: 46430 (gunicorn)
      Tasks: 4 (limit: 2344)
     Memory: 51.3M
     CGroup: /system.slice/myproject.service
             ├─46430 /home/sammy/myproject/myprojectenv/bin/python3 /home/sammy/myproject/myprojectenv/bin/gunicorn --workers 3 --bind unix:myproject.sock -m 007 wsgi:app
             ├─46449 /home/sammy/myproject/myprojectenv/bin/python3 /home/sammy/myproject/myprojectenv/bin/gunicorn --workers 3 --bind unix:myproject.sock -m 007 wsgi:app
             ├─46450 /home/sammy/myproject/myprojectenv/bin/python3 /home/sammy/myproject/myprojectenv/bin/gunicorn --workers 3 --bind unix:myproject.sock -m 007 wsgi:app
             └─46451 /home/sammy/myproject/myprojectenv/bin/python3 /home/sammy/myproject/myprojectenv/bin/gunicorn --workers 3 --bind unix:myproject.sock -m 007 wsgi:app

If you see any errors, be sure to resolve them before continuing with the tutorial.

Our Gunicorn application server should now be up and running, waiting for requests on the socket file in the project directory. Let’s now configure Nginx to pass web requests to that socket by making some small additions to its configuration file.

Begin by creating a new server block configuration file in Nginx’s sites-available directory. Let’s call this myproject to keep in line with the rest of the guide:

 $ sudo nano /etc/nginx/sites-available/myproject

Open up a server block and tell Nginx to listen on the default port 80. Let’s also tell it to use this block for requests for our server’s domain name:

/etc/nginx/sites-available/myproject
server {
    listen 80;
    server_name your_domain www.your_domain;
}

Next, let’s add a location block that matches every request. Within this block, we’ll include the proxy_params file that specifies some general proxying parameters that need to be set. We’ll then pass the requests to the socket we defined using the proxy_pass directive:

/etc/nginx/sites-available/myproject
server {
    listen 80;
    server_name your_domain www.your_domain;

    location / {
        include proxy_params;
        proxy_pass http://unix:/home/sammy/myproject/myproject.sock;
    }
}

Save and close the file when you’re finished.

To enable the Nginx server block configuration you’ve just created, link the file to the sites-enabled directory:

 $ sudo ln -s /etc/nginx/sites-available/myproject

With the file in that directory, you can test for syntax errors:

 $ sudo nginx -t

If this returns without indicating any issues, restart the Nginx process to read the new configuration:

 $ sudo systemctl restart nginx

Finally, let’s adjust the firewall again. We no longer need access through port 5000, so we can remove that rule. We can then allow full access to the Nginx server:

 $ sudo ufw delete allow 5000
 $ sudo ufw allow 'Nginx Full'

You should now be able to navigate to your server’s domain name in your web browser:

http://your_domain

You should see your application’s output:

Flask sample app

If you encounter any errors, trying checking the following:

  • sudo less /var/log/nginx/error.log: checks the Nginx error logs.
  • sudo less /var/log/nginx/access.log: checks the Nginx access logs.
  • sudo journalctl -u nginx: checks the Nginx process logs.
  • sudo journalctl -u myproject: checks your Flask app’s Gunicorn logs.

To ensure that traffic to your server remains secure, let’s get an SSL certificate for your domain. There are multiple ways to do this, including getting a free certificate from Let’s Encryptgenerating a self-signed certificate, or buying one from another provider and configuring Nginx to use it by following Steps 2 through 6 of How to Create a Self-signed SSL Certificate for Nginx in Ubuntu 20.04. We will go with option one for the sake of expediency.

Install Certbot’s Nginx package with apt:

  • sudo apt install python3-certbot-nginx

Certbot provides a variety of ways to obtain SSL certificates through plugins. The Nginx plugin will take care of reconfiguring Nginx and reloading the config whenever necessary. To use this plugin, type the following:

  • sudo certbot –nginx -d your_domain -d www.your_domain

This runs certbot with the --nginx plugin, using -d to specify the names we’d like the certificate to be valid for.

If this is your first time running certbot, you will be prompted to enter an email address and agree to the terms of service. After doing so, certbot will communicate with the Let’s Encrypt server, then run a challenge to verify that you control the domain you’re requesting a certificate for.

If that’s successful, certbot will ask how you’d like to configure your HTTPS settings:

Output
Please choose whether or not to redirect HTTP traffic to HTTPS, removing HTTP access.
-------------------------------------------------------------------------------
1: No redirect - Make no further changes to the webserver configuration.
2: Redirect - Make all requests redirect to secure HTTPS access. Choose this for
new sites, or if you're confident your site works on HTTPS. You can undo this
change by editing your web server's configuration.
-------------------------------------------------------------------------------
Select the appropriate number [1-2] then [enter] (press 'c' to cancel):

Select your choice then hit ENTER. The configuration will be updated, and Nginx will reload to pick up the new settings. certbot will wrap up with a message telling you the process was successful and where your certificates are stored:

Output
IMPORTANT NOTES:
 - Congratulations! Your certificate and chain have been saved at:
   /etc/letsencrypt/live/your_domain/fullchain.pem
   Your key file has been saved at:
   /etc/letsencrypt/live/your_domain/privkey.pem
   Your cert will expire on 2020-08-18. To obtain a new or tweaked
   version of this certificate in the future, simply run certbot again
   with the "certonly" option. To non-interactively renew *all* of
   your certificates, run "certbot renew"
 - Your account credentials have been saved in your Certbot
   configuration directory at /etc/letsencrypt. You should make a
   secure backup of this folder now. This configuration directory will
   also contain certificates and private keys obtained by Certbot so
   making regular backups of this folder is ideal.
 - If you like Certbot, please consider supporting our work by:

   Donating to ISRG / Let's Encrypt:   https://letsencrypt.org/donate
   Donating to EFF:                    https://eff.org/donate-le

If you followed the Nginx installation instructions in the prerequisites, you will no longer need the redundant HTTP profile allowance:

 $ sudo ufw delete allow 'Nginx HTTP'

To verify the configuration, navigate once again to your domain, using https://:

https://your_domain

You should see your application output once again, along with your browser’s security indicator, which should indicate that the site is secured.

Conclusion

In this guide, you created and secured a simple Flask application within a Python virtual environment. You created a WSGI entry point so that any WSGI-capable application server can interface with it, and then configured the Gunicorn app server to provide this function. Afterwards, you created a systemd service file to automatically launch the application server on boot. You also created an Nginx server block that passes web client traffic to the application server, relaying external requests, and secured traffic to your server with Let’s Encrypt.

Flask is a very simple, but extremely flexible framework meant to provide your applications with functionality without being too restrictive about structure and design. You can use the general stack described in this guide to serve the flask applications that you design.

How To Install Git from Source on Ubuntu 20.04 [Quickstart]

Introduction

Version control systems help you collaborate on software development projects. Git is one of the most popular version control systems currently available.

This tutorial will walk you through installing and configuring Git from source on an Ubuntu 20.04 server. For a more detailed version of this tutorial, with more thorough explanations of each step, please refer to How To Install Git on Ubuntu 20.04.

Step 1 — Confirm Git Preinstallation

Verify whether you have a version of Git currently installed on the server:

  • git –version

If Git is installed, you’ll receive output similar to the following:

Output
git version 2.25.1

Whether or not you have Git installed already, it is worth checking to make sure that you install a more recent version during this process.

Step 2 — Update and Install Dependencies

You’ll next need to install the software that Git depends on. This is all available in the default Ubuntu repositories, so we can update our local package index and then install the relevant packages.

  • sudo apt update
  • sudo apt install libz-dev libssl-dev libcurl4-gnutls-dev libexpat1-dev gettext cmake gcc

Press y to confirm if prompted. Necessary dependencies should now be installed.

Step 3 — Install Tarball

Create a temporary directory to download our Git tarball and move into it.

  • mkdir tmp
  • cd /tmp

From the Git project website, we can navigate to the tarball list available at https://mirrors.edge.kernel.org/pub/software/scm/git/ and download the version you would like. At the time of writing, the most recent version is 2.26.2, so we will download that for demonstration purposes. We’ll use curl and output the file we download to git.tar.gz.

  • curl -o git.tar.gz https://mirrors.edge.kernel.org/pub/software/scm/git/git-2.26.2.tar.gz

Step 4 — Unpack Compressed File and Install the Package

Unpack the compressed tarball file:

  • tar -zxf git.tar.gz

Next, move into the new Git directory:

  • cd git-*

Now, you can make the package and install it by typing these two commands:

  • make prefix=/usr/local all
  • sudo make prefix=/usr/local install

Now, replace the shell process so that the version of Git we just installed will be used:

  • exec bash

Step 5 — Verify New Version of Git

You can be sure that your install was successful by checking the version.

  • git –version
Output
git version 2.26.2

With Git successfully installed, you can now complete your setup.

Step 6 — Set Up Git

Now that you have Git installed and to prevent warnings, you should configure it with your information.

  • git config –global user.name “Your Name
  • git config –global user.email “[email protected]

If you need to edit this file, you can use a text editor such as nano:

  • nano ~/.gitconfig
~/.gitconfig contents
[user]
  name = Your Name
  email = [email protected]

To learn more about how to use Git, check out these articles and series:

How To Install and Configure Zabbix to Securely Monitor Remote Servers on Ubuntu 20.04

The author selected the Computer History Museum to receive a donation as part of the Write for DOnations program.

Introduction

Zabbix is open-source monitoring software for networks and applications. It offers real-time monitoring of thousands of metrics collected from servers, virtual machines, network devices, and web applications. These metrics can help you determine the current health of your IT infrastructure and detect problems with hardware or software components before customers complain. Useful information is stored in a database so you can analyze data over time and improve the quality of provided services or plan upgrades of your equipment.

Zabbix uses several options for collecting metrics, including agentless monitoring of user services and client-server architecture. To collect server metrics, it uses a small agent on the monitored client to gather data and send it to the Zabbix server. Zabbix supports encrypted communication between the server and connected clients, so your data is protected while it travels over insecure networks.

The Zabbix server stores its data in a relational database powered by MySQL or PostgreSQL. You can also store historical data in NoSQL databases like Elasticsearch and TimescaleDB. Zabbix provides a web interface so you can view data and configure system settings.

In this tutorial, you will configure Zabbix on two Ubuntu 20.04 machines. One will be configured as the Zabbix server, and the other as a client that you’ll monitor. The Zabbix server will use a MySQL database to record monitoring data and use Nginx to serve the web interface.

Prerequisites

To follow this tutorial, you will need:

  • Two Ubuntu 20.04 servers set up by following the Initial Server Setup Guide for Ubuntu 20.04, including a non-root user with sudo privileges and a firewall configured with ufw. On one server, you will install Zabbix; this tutorial will refer to this as the Zabbix server. It will monitor your second server; this second server will be referred to as the second Ubuntu server.
  • The server that will run the Zabbix server needs Nginx, MySQL, and PHP installed. Follow Steps 1–3 of our Ubuntu 20.04 LEMP Stack guide to configure those on your Zabbix server.
  • A registered domain name. This tutorial will use your_domain throughout. You can purchase a domain name from Namecheap, get one for free with Freenom, or use the domain registrar of your choice.
  • Both of the following DNS records set up for your Zabbix server. If you are using DigitalOcean, please see our DNS documentation for details on how to add them.
    • An A record with your_domain pointing to your Zabbix server’s public IP address.
    • An A record with www.your_domain pointing to your Zabbix server’s public IP address.

Additionally, because the Zabbix Server is used to access valuable information about your infrastructure that you would not want unauthorized users to access, it’s important that you keep your server secure by installing a TLS/SSL certificate. This is optional but strongly encouraged. If you would like to secure your server, follow the Let’s Encrypt on Ubuntu 20.04 guide after Step 3 of this tutorial.

Step 1 — Installing the Zabbix Server

First, you need to install Zabbix on the server where you installed MySQL, Nginx, and PHP. Log in to this machine as your non-root user:

  • ssh sammy@zabbix_server_ip_address

Zabbix is available in Ubuntu’s package manager, but it’s outdated, so use the official Zabbix repository to install the latest stable version. Download and install the repository configuration package:

  • wget https://repo.zabbix.com/zabbix/5.0/ubuntu/pool/main/z/zabbix-release/zabbix-release_5.0-1+focal_all.deb
  • sudo dpkg -i zabbix-release_5.0-1+focal_all.deb

You will see the following output:

Output
Selecting previously unselected package zabbix-release.
(Reading database ... 64058 files and directories currently installed.)
Preparing to unpack zabbix-release_5.0-1+focal_all.deb ...
Unpacking zabbix-release (1:5.0-1+focal) ...
Setting up zabbix-release (1:5.0-1+focal) ...

Update the package index so the new repository is included:

  • sudo apt update

Then install the Zabbix server and web frontend with MySQL database support:

  • sudo apt install zabbix-server-mysql zabbix-frontend-php

Also, install the Zabbix agent, which will let you collect data about the Zabbix server status itself.

  • sudo apt install zabbix-agent

Before you can use Zabbix, you have to set up a database to hold the data that the Zabbix server will collect from its agents. You can do this in the next step.

Step 2 — Configuring the MySQL Database for Zabbix

You need to create a new MySQL database and populate it with some basic information in order to make it suitable for Zabbix. You’ll also create a specific user for this database so Zabbix isn’t logging in to MySQL with the root account.

Log in to MySQL as the root user:

  • sudo mysql

Create the Zabbix database with UTF-8 character support:

  • create database zabbix character set utf8 collate utf8_bin;

Then create a user that the Zabbix server will use, give it access to the new database, and set the password for the user:

  • create user zabbix@localhost identified by ‘your_zabbix_mysql_password‘;
  • grant all privileges on zabbix.* to zabbix@localhost;

That takes care of the user and the database. Exit out of the database console.

  • quit;

Next you have to import the initial schema and data. The Zabbix installation provided you with a file that sets this up.

Run the following command to set up the schema and import the data into the zabbix database. Use zcat since the data in the file is compressed:

  • zcat /usr/share/doc/zabbix-server-mysql*/create.sql.gz | mysql -uzabbix -p zabbix

Enter the password for the zabbix MySQL user that you configured when prompted.

This command may take a minute or two to execute. If you see the error ERROR 1045 (28000): Access denied for userzabbix@'localhost' (using password: YES) then make sure you used the right password for the zabbix user.

In order for the Zabbix server to use this database, you need to set the database password in the Zabbix server configuration file. Open the configuration file in your preferred text editor. This tutorial will use nano:

  • sudo nano /etc/zabbix/zabbix_server.conf

Look for the following section of the file:

/etc/zabbix/zabbix_server.conf
...
### Option: DBPassword                           
#       Database password. Ignored for SQLite.   
#       Comment this line if no password is used.
#                                                
# Mandatory: no                                  
# Default:                                       
# DBPassword=
...

These comments in the file explain how to connect to the database. You need to set the DBPassword value in the file to the password for your database user. Add this line after those comments to configure the database:

/etc/zabbix/zabbix_server.conf
...
DBPassword=your_zabbix_mysql_password
...

Save and close zabbix_server.conf by pressing CTRL+X, followed by Y and then ENTER if you’re using nano.

You’ve now configured the Zabbix server to connect to the database. Next, you will configure the Nginx web server to serve the Zabbix frontend.

Step 3 — Configuring Nginx for Zabbix

To configure Nginx automatically, install the automatic configuration package:

  • sudo apt install zabbix-nginx-conf

As a result, you will get the configuration file /etc/zabbix/nginx.conf, as well as a link to it in the Nginx configuration directory /etc/nginx/conf.d/zabbix.conf.

Next, you need to make changes to this file. Open the configuration file:

  • sudo nano /etc/zabbix/nginx.conf

The file contains an automatically generated Nginx server block configuration. It contains two lines that determine the server name and what port it is listening on:

/etc/zabbix/nginx.conf
server {
#        listen          80;
#        server_name     example.com;
...

Uncomment the two lines, and replace example.com with your domain name. Your settings will look like this:

/etc/zabbix/nginx.conf
server {
        listen          80;
        server_name     your_domain;
...

Save and close the file. Next, test to make sure that there are no syntax errors in any of your Nginx files and reload the configuration:

  • sudo nginx -t
  • sudo nginx -s reload

Now that Nginx is set up to serve the Zabbix frontend, you will make some modifications to your PHP setup in order for the Zabbix web interface to work properly.

Note: As mentioned in the Prerequisites section, it is recommended that you enable SSL/TLS on your server. If you would like to do this, follow our Ubuntu 20.04 Let’s Encrypt tutorial before you move on to Step 4 to obtain a free SSL certificate for Nginx. This process will automatically detect your Zabbix server block and configure it for HTTPS. After obtaining your SSL/TLS certificates, you can come back and complete this tutorial.

Step 4 — Configuring PHP for Zabbix

The Zabbix web interface is written in PHP and requires some special PHP server settings. The Zabbix installation process created a PHP-FPM configuration file that contains these settings. It is located in the directory /etc/zabbix and is loaded automatically by PHP-FPM. You need to make a small change to this file, so open it up with the following:

  • sudo nano /etc/zabbix/php-fpm.conf

The file contains PHP settings that meet the necessary requirements for the Zabbix web interface. However, the timezone setting is commented out by default. To make sure that Zabbix uses the correct time, you need to set the appropriate timezone:

/etc/zabbix/php-fpm.conf
...
php_value[max_execution_time] = 300
php_value[memory_limit] = 128M
php_value[post_max_size] = 16M
php_value[upload_max_filesize] = 2M
php_value[max_input_time] = 300
php_value[max_input_vars] = 10000
; php_value[date.timezone] = Europe/Riga

Uncomment the timezone line highlighted in the preceding code block and change it to your timezone. You can use this list of supported time zones to find the right one for you. Then save and close the file.

Now restart PHP-FPM to apply these new settings:

  • sudo systemctl restart php7.4-fpm.service

You can now start the Zabbix server:

  • sudo systemctl start zabbix-server

Then check whether the Zabbix server is running properly:

  • sudo systemctl status zabbix-server

You will see the following status:

Output
● zabbix-server.service - Zabbix Server
     Loaded: loaded (/lib/systemd/system/zabbix-server.service; disabled; vendor preset: enabled)
     Active: active (running) since Fri 2020-06-12 05:59:32 UTC; 36s ago
    Process: 27026 ExecStart=/usr/sbin/zabbix_server -c $CONFFILE (code=exited, status=0/SUCCESS)
  ...

Finally, enable the server to start at boot time:

  • sudo systemctl enable zabbix-server

The server is set up and connected to the database. Next, set up the web frontend.

Step 5 — Configuring Settings for the Zabbix Web Interface

The web interface lets you see reports and add hosts that you want to monitor, but it needs some initial setup before you can use it. Launch your browser and go to the address http://zabbix_server_name or https://zabbix_server_name if you set up Let’s Encrypt. On the first screen, you will see a welcome message. Click Next step to continue.

On the next screen, you will see the table that lists all of the prerequisites to run Zabbix.

Prerequisites

All of the values in this table must be OK, so verify that they are. Be sure to scroll down and look at all of the prerequisites. Once you’ve verified that everything is ready to go, click Next step to proceed.

The next screen asks for database connection information.

DB Connection

You told the Zabbix server about your database, but the Zabbix web interface also needs access to the database to manage hosts and read data. Therefore enter the MySQL credentials you configured in Step 2. Click Next step to proceed.

On the next screen, you can leave the options at their default values.

Zabbix Server Details

The Name is optional; it is used in the web interface to distinguish one server from another in case you have several monitoring servers. Click Next step to proceed.

The next screen will show the pre-installation summary so you can confirm everything is correct.

Summary

Click Next step to proceed to the final screen.

The web interface setup is now complete. This process creates the configuration file /usr/share/zabbix/conf/zabbix.conf.php, which you could back up and use in the future. Click Finish to proceed to the login screen. The default user is Admin and the password is zabbix.

Before you log in, set up the Zabbix agent on your second Ubuntu server.

Step 6 — Installing and Configuring the Zabbix Agent

Now you need to configure the agent software that will send monitoring data to the Zabbix server.

Log in to the second Ubuntu server:

  • ssh sammy@second_ubuntu_server_ip_address

Just like on the Zabbix server, run the following commands to install the repository configuration package:

  • wget https://repo.zabbix.com/zabbix/5.0/ubuntu/pool/main/z/zabbix-release/zabbix-release_5.0-1+focal_all.deb
  • sudo dpkg -i zabbix-release_5.0-1+focal_all.deb

Next, update the package index:

  • sudo apt update

Then install the Zabbix agent:

  • sudo apt install zabbix-agent

While Zabbix supports certificate-based encryption, setting up a certificate authority is beyond the scope of this tutorial. But you can use pre-shared keys (PSK) to secure the connection between the server and agent.

First, generate a PSK:

  • sudo sh -c “openssl rand -hex 32 > /etc/zabbix/zabbix_agentd.psk”

Show the key by using cat so you can copy it somewhere:

  • cat /etc/zabbix/zabbix_agentd.psk

The key will look something like this:

Output
75ad6cb5e17d244ac8c00c96a1b074d0550b8e7b15d0ab3cde60cd79af280fca

Save this for later; you will need it to configure the host.

Now edit the Zabbix agent settings to set up its secure connection to the Zabbix server. Open the agent configuration file in your text editor:

  • sudo nano /etc/zabbix/zabbix_agentd.conf

Each setting within this file is documented via informative comments throughout the file, but you only need to edit some of them.

First you have to edit the IP address of the Zabbix server. Find the following section:

/etc/zabbix/zabbix_agentd.conf
...
### Option: Server
#       List of comma delimited IP addresses, optionally in CIDR notation, or DNS names of Zabbix servers and Zabbix proxies.
#       Incoming connections will be accepted only from the hosts listed here.
#       If IPv6 support is enabled then '127.0.0.1', '::127.0.0.1', '::ffff:127.0.0.1' are treated equally
#       and '::/0' will allow any IPv4 or IPv6 address.
#       '0.0.0.0/0' can be used to allow any IPv4 address.
#       Example: Server=127.0.0.1,192.168.1.0/24,::1,2001:db8::/32,zabbix.example.com
#
# Mandatory: yes, if StartAgents is not explicitly set to 0
# Default:
# Server=

Server=127.0.0.1
...

Change the default value to the IP of your Zabbix server:

/etc/zabbix/zabbix_agentd.conf
...
Server=zabbix_server_ip_address
...

By default, Zabbix server connects to the agent. But for some checks (for example, monitoring the logs), a reverse connection is required. For correct operation, you need to specify the Zabbix server address and a unique host name.

Find the section that configures the active checks and change the default values:

/etc/zabbix/zabbix_agentd.conf
...
##### Active checks related

### Option: ServerActive
#       List of comma delimited IP:port (or DNS name:port) pairs of Zabbix servers and Zabbix proxies for active checks.
#       If port is not specified, default port is used.
#       IPv6 addresses must be enclosed in square brackets if port for that host is specified.
#       If port is not specified, square brackets for IPv6 addresses are optional.
#       If this parameter is not specified, active checks are disabled.
#       Example: ServerActive=127.0.0.1:20051,zabbix.domain,[::1]:30051,::1,[12fc::1]
#
# Mandatory: no
# Default:
# ServerActive=

ServerActive=zabbix_server_ip_address

### Option: Hostname
#       Unique, case sensitive hostname.
#       Required for active checks and must match hostname as configured on the server.
#       Value is acquired from HostnameItem if undefined.
#
# Mandatory: no
# Default:
# Hostname=

Hostname=Second Ubuntu Server
...

Next, find the section that configures the secure connection to the Zabbix server and enable pre-shared key support. Find the TLSConnect section, which looks like this:

/etc/zabbix/zabbix_agentd.conf
...
### Option: TLSConnect
#       How the agent should connect to server or proxy. Used for active checks.
#       Only one value can be specified:
#               unencrypted - connect without encryption
#               psk         - connect using TLS and a pre-shared key
#               cert        - connect using TLS and a certificate
#
# Mandatory: yes, if TLS certificate or PSK parameters are defined (even for 'unencrypted' connection)
# Default:
# TLSConnect=unencrypted
...

Then add this line to configure pre-shared key support:

/etc/zabbix/zabbix_agentd.conf
...
TLSConnect=psk
...

Next, locate the TLSAccept section, which looks like this:

/etc/zabbix/zabbix_agentd.conf
...
### Option: TLSAccept
#       What incoming connections to accept.
#       Multiple values can be specified, separated by comma:
#               unencrypted - accept connections without encryption
#               psk         - accept connections secured with TLS and a pre-shared key
#               cert        - accept connections secured with TLS and a certificate
#
# Mandatory: yes, if TLS certificate or PSK parameters are defined (even for 'unencrypted' connection)
# Default:
# TLSAccept=unencrypted
...

Configure incoming connections to support pre-shared keys by adding this line:

/etc/zabbix/zabbix_agentd.conf
...
TLSAccept=psk
...

Next, find the TLSPSKIdentity section, which looks like this:

/etc/zabbix/zabbix_agentd.conf
...
### Option: TLSPSKIdentity
#       Unique, case sensitive string used to identify the pre-shared key.
#
# Mandatory: no
# Default:
# TLSPSKIdentity=
...

Choose a unique name to identify your pre-shared key by adding this line:

/etc/zabbix/zabbix_agentd.conf
...
TLSPSKIdentity=PSK 001
...

You’ll use this as the PSK ID when you add your host through the Zabbix web interface.

Then set the option that points to your previously created pre-shared key. Locate the TLSPSKFileoption:

/etc/zabbix/zabbix_agentd.conf
...
### Option: TLSPSKFile
#       Full pathname of a file containing the pre-shared key.
#
# Mandatory: no
# Default:
# TLSPSKFile=
...

Add this line to point the Zabbix agent to your PSK file you created:

/etc/zabbix/zabbix_agentd.conf
...
TLSPSKFile=/etc/zabbix/zabbix_agentd.psk
...

Save and close the file. Now you can restart the Zabbix agent and set it to start at boot time:

  • sudo systemctl restart zabbix-agent
  • sudo systemctl enable zabbix-agent

For good measure, check that the Zabbix agent is running properly:

  • sudo systemctl status zabbix-agent

You will see the following status, indicating the agent is running:

Output
● zabbix-agent.service - Zabbix Agent
   Loaded: loaded (/lib/systemd/system/zabbix-agent.service; enabled; vendor preset: enabled)
   Active: active (running) since Fri 2020-06-12 08:19:54 UTC; 25s ago
  ...

The agent will listen on port 10050 for connections from the server. Configure UFW to allow connections to this port:

  • sudo ufw allow 10050/tcp

You can learn more about UFW in How To Set Up a Firewall with UFW on Ubuntu 20.04.

Your agent is now ready to send data to the Zabbix server. But in order to use it, you have to link to it from the server’s web console. In the next step, you will complete the configuration.

Step 7 — Adding the New Host to the Zabbix Server

Installing an agent on a server you want to monitor is only half of the process. Each host you want to monitor needs to be registered on the Zabbix server, which you can do through the web interface.

Log in to the Zabbix Server web interface by navigating to the address http://zabbix_server_name or https://zabbix_server_name:

The Zabbix login screen

When you have logged in, click on Configuration and then Hosts in the left navigation bar. Then click the Create host button in the top right corner of the screen. This will open the host configuration page.

Creating a host

Adjust the Host name and IP address to reflect the host name and IP address of your second Ubuntu server, then add the host to a group. You can select an existing group, for example Linux servers, or create your own group. The host can be in multiple groups. To do this, enter the name of an existing or new group in the Groups field and select the desired value from the proposed list.

Before adding the group, click the Templates tab.

Adding a template to the host

Type Template OS Linux by Zabbix agent in the Search field and then select it from the list to add this template to the host.

Next, navigate to the Encryption tab. Select PSK for both Connections to host and Connections from host. Then set PSK identity to PSK 001, which is the value of the TLSPSKIdentity setting of the Zabbix agent you configured previously. Then set PSK value to the key you generated for the Zabbix agent. It’s the one stored in the file /etc/zabbix/zabbix_agentd.psk on the agent machine.

Setting up the encryption

Finally, click the Add button at the bottom of the form to create the host.

You will see your new host in the list. Wait for a minute and reload the page to see green labels indicating that everything is working fine and the connection is encrypted.

Zabbix shows your new host

If you have additional servers you need to monitor, log in to each host, install the Zabbix agent, generate a PSK, configure the agent, and add the host to the web interface following the same steps you followed to add your first host.

The Zabbix server is now monitoring your second Ubuntu server. Now, set up email notifications to be notified about problems.

Step 8 — Configuring Email Notifications

Zabbix automatically supports many types of notifications: email, OTRSSlackTelegram, SMS, etc. You can see the full list of integrations at the Zabbix website.

As an example, this tutorial will configure notifications for the Email media type.

Click on Administration, and then Media types in the left navigation bar. You will see the list of all media types. There are two preconfigured options for emails: for the plain text notification and for the HTML notifications. In this tutorial you will use plain text notification. Click on Email.

Adjust the SMTP options according to the settings provided by your email service. This tutorial uses Gmail’s SMTP capabilities to set up email notifications; if you would like more information about setting this up, see How To Use Google’s SMTP Server.


Note: If you use 2-Step Verification with Gmail, you need to generate an App Password for Zabbix. You’ll only have to enter an App password once during setup. You will find instructions on how to generate this password in the Google Help Center.

If you are using Gmail, type in smtp.gmail.com for the SMTP server field, 465 for the SMTP server port field, gmail.com for SMTP helo, and your email for SMTP email. Then choose SSL/TLS for Connection security and Username and password for Authentication. Enter your Gmail address as the Username, and the App Password you generated from your Google account as the Password.

Setting up email media type

On the Message templates tab you can see the list of predefined messages for various types of notifications. Finally, click the Update button at the bottom of the form to update the email parameters.

Now you can test sending notifications. To do this, click the Test underlined link in the corresponding line.

You will see a pop-up window. Enter your email address in the Send to field and click the Testbutton. You will see a message about the successful sending and you will receive a test message.

Testing email

Close the pop-up by clicking the Cancel button.

Now, create a new user. Click on Administration, and then Users in the left navigation bar. You will see the list of users. Then click the Create user button in the top right corner of the screen. This will open the user configuration page:

Creating a user

Enter the new username in the Alias field and set up a new password. Next, add the user to the administrator’s group. Type Zabbix administrators in the Groups field and select it from the proposed list.

Once you’ve added the group, click the Media tab and click on the Add underlined link (not the Add button below it). You will see a pop-up window.

Adding an email

Select the Email option from the Type drop down. Enter your email address in the Send to field. You can leave the rest of the options at the default values. Click the Add button at the bottom to submit.

Now navigate to the Permissions tab. Select Zabbix Super Admin from the User type drop-down menu.

Finally, click the Add button at the bottom of the form to create the user.

Note: Using the default password is not safe. In order to change the password of the built-in user Admin click on the alias in the list of users. Then click Change password, enter a new password, and confirm the changes by clicking Update button.

Now you need to enable notifications. Click on the Configuration tab and then Actions in the left navigation bar. You will see a pre-configured action, which is responsible for sending notifications to all Zabbix administrators. You can review and change the settings by clicking on its name. For the purposes of this tutorial, use the default parameters. To enable the action, click on the red Disabled link in the Status column.

Now you are ready to receive alerts. In the next step, you will generate one to test your notification setup.

Step 9 — Generating a Test Alert

In this step, you will generate a test alert to ensure everything is connected. By default, Zabbix keeps track of the amount of free disk space on your server. It automatically detects all disk mounts and adds the corresponding checks. This discovery is executed every hour, so you need to wait a while for the notification to be triggered.

Create a temporary file that’s large enough to trigger Zabbix’s file system usage alert. To do this, log in to your second Ubuntu server if you’re not already connected:

  • ssh sammy@second_ubuntu_server_ip_address

Next, determine how much free space you have on the server. You can use the df command to find out:

  • df -h

The command df will report the disk space usage of your file system, and the -h will make the output human-readable. You’ll see output like the following:

Output
Filesystem      Size  Used Avail Use% Mounted on
/dev/vda1        78G  1.4G   77G    2% /

In this case, the free space is 77G. Your free space may differ.

Use the fallocate command, which allows you to pre-allocate or de-allocate space to a file, to create a file that takes up more than 80% of the available disk space. This will be enough to trigger the alert:

  • fallocate -l 70G /tmp/temp.img

After around an hour, Zabbix will trigger an alert about the amount of free disk space and will run the action you configured, sending the notification message. You can check your inbox for the message from the Zabbix server. You will see a message like:

Problem started at 09:49:08 on 2020.06.12
Problem name: /: Disk space is low (used > 80%)
Host: Second Ubuntu Server
Severity: Warning
Operational data: Space used: 71.34 GB of 77.36 GB (92.23 %)
Original problem ID: 106

You can also navigate to the Monitoring tab and then Dashboard to see the notification and its details.

Main dashboard

Now that you know the alerts are working, delete the temporary file you created so you can reclaim your disk space:

  • rm -f /tmp/temp.img

After a minute Zabbix will send the recovery message and the alert will disappear from the main dashboard.

Conclusion

In this tutorial, you learned how to set up a simple and secure monitoring solution that will help you monitor the state of your servers. It can now warn you of problems, and you have the opportunity to analyze the processes occurring in your IT infrastructure.

To learn more about setting up monitoring infrastructure, check out our Monitoring topic page.

How To Install Mod_Security Apache on CentOS 7

Install Mod_Security Apache on CentOS 7

ModSecurity is an open source, cross platform web application firewall (WAF) developed by Trustwave’s SpiderLabs. It has a robust event-based programming language which provides protection from a range of attacks against web applications and allows for HTTP traffic monitoring, logging and real-time analysis. In this tutorial we will learn how To Install Mod_Security Apache on CentOS 7

This article assumes you have at least basic knowledge of Linux, know how to use the shell, and most importantly, you host your site on your own VPS. The installation is quite simple and assumes you are running in the root account, if not you may need to add ‘sudo’ to the commands to get root privileges. I will show you through the step by step installation ModSecurity on a CentOS 7 server.

Install Mod_Security Apache on CentOS 7

Step 1. First, let’s start by ensuring your system is up-to-date.

yum clean all
yum -y update

Step 2. Installing Mod_Security Apache on CentOS

Install Dependencies for mod_security:

yum install gcc make httpd-devel libxml2 pcre-devel libxml2-devel curl-devel git

Next, download latest stable release of mod_security source code from their official website to your server:

wget https://www.modsecurity.org/tarball/2.9.3/modsecurity-2.9.3.tar.gz
tar xzf modsecurity-apache_2.9.3.tar.gz
cd modsecurity-apache_2.9.3
./configure
make install
cp modsecurity.conf-recommended /etc/httpd/conf.d/modsecurity.conf
cp unicode.mapping /etc/httpd/conf.d/

Step 3. Configuring Mod_Security.

# nano /etc/httpd/conf/httpd.conf
LoadModule security2_module modules/mod_security2.so

Now set the basic rule set in your httpd.conf file. Add the following lines of code at the end of the file:

<IfModule security2_module>
    Include conf.d/modsecurity.conf
</IfModule>

Save the changes and restart Apache:

systemctl restart httpd

Step 4. Download and configure OWASP (Open Web Application Security Project) core rule set for a base configuration.

cd /etc/httpd
git clone https://github.com/SpiderLabs/owasp-modsecurity-crs.git
mv owasp-modsecurity-crs modsecurity-crs
cd modsecurity-crs
cp modsecurity_crs_10_setup.conf.example modsecurity_crs_10_config.conf

Open the Apache configuration file again, and add the following lines at the end of the file:

# nano /etc/httpd/conf/httpd.conf

Include modsecurity-crs/modsecurity_crs_10_config.conf
Include modsecurity-crs/base_rules/*.conf

Next, restart the Apache service to enable mod_security module:

systemctl restart httpd

Congratulation’s! You have successfully installed Mod_Security. Thanks for using this tutorial for installing Mod_Security on CentOS 7 system. For additional help or useful information, we recommend you to check the official ModSecurity website.

How To Install Orangescrum on Ubuntu 18.04 LTS

Install Orangescrum on Ubuntu 18

Orangescrum is a free, open source, flexible project management web application written using CakePHP. It helps you to manage projects, teams, documents, and tasks, all in one place. Orangescrum provides various features like agile project management, collaboration, issue tracking, notifications, reporting, task management, and traditional project management functionality for small/medium businesses. Continue reading “How To Install Orangescrum on Ubuntu 18.04 LTS”

How To Install Graylog on Ubuntu 18.04 LTS

Install Graylog on Ubuntu 18

Graylog is a free and open source powerful centralized log management tool based on Elasticsearch and MongoDB. Graylog helps you to collect, index and analyze any machine logs centrally.

This article assumes you have at least basic knowledge of Linux, know how to use the shell, and most importantly, you host your site on your own VPS. The installation is quite simple and assumes you are running in the root account, if not you may need to add ‘sudo’ to the commands to get root privileges. I will show you through the step by step installation Graylog on an Ubuntu 18.04 (Bionic Beaver) server.

Install Graylog on Ubuntu 18.04 LTS Bionic Beaver

Step 1. First, make sure that all your system packages are up-to-date by running these following apt-get commands in the terminal.

sudo apt update
sudo apt upgrade

Step 2. Installing Java.

Graylog is built using java, so it can technically run anywhere, however this may require you to install the Java Development Kit which contains the Runtime Environment too:

sudo apt install apt-transport-https uuid-runtime pwgen openjdk-8-jre-headless

Now check the java version:

java -version

Step 3. Installing MongoDB.

A stable version of MongoDB packages are already in the default Ubuntu repository. However, the version in Ubuntu’s repository isn’t the latest. If you want to install the latest version you must add a third-party repository to your system and install it from there:

sudo apt-key adv --keyserver hkp://keyserver.ubuntu.com:80 --recv 0C49F3730359A14518585931BC711F9BA15703C6

After adding the repository key to Ubuntu, run the commands below to add MongoDB repository to your system:

echo "deb http://repo.mongodb.org/apt/ubuntu trusty/mongodb-org/3.4 multiverse" | sudo tee /etc/apt/sources.list.d/mongodb-org-3.4.list

After that, update your system and refresh existing repositories by running the commands below:

apt update

And now install the latest stable version of MongoDB:

apt install -y mongodb-org

Step 4. Installing Elasticsearch.

First, install Elasticsearch using the apt package manager from the official Elastic repository:

wget -qO - https://packages.elastic.co/GPG-KEY-elasticsearch | sudo apt-key add -
echo "deb http://packages.elastic.co/elasticsearch/2.x/debian stable main" | sudo tee -a /etc/apt/sources.list.d/elasticsearch-2.x.list
apt-get update

Then, install Elasticsearch with apt using the following command:

apt-get -y install elasticsearch

Start the Elasticsearch service and set it to automatically start on boot:

systemctl restart elasticsearch
systemctl enable elasticsearch

Once Elasticsearch is installed, you will need to modify the Elasticsearch main configuration file:

nano /etc/elasticsearch/elasticsearch.yml

Make the following changes:

cluster.name: graylog
network.host: 127.0.0.1
discovery.zen.ping.timeout: 10s
discovery.zen.ping.multicast.enabled: false
discovery.zen.ping.unicast.hosts: ["127.0.0.1:9300"]
script.inline: false
script.indexed: false
script.file: false

After a few seconds, run the following to test that Elasticsearch is running properly:

curl -X GET http://localhost:9200

Step 5. Installing Graylog.

Graylog is not available in the Ubuntu 18.04 default repository, you need to download and install the Graylog repository to your system:

wget https://packages.graylog2.org/repo/packages/graylog-2.4-repository_latest.deb
dpkg -i graylog-2.4-repository_latest.deb

Update the package lists and install Graylog:

apt-get update -y
apt-get install graylog-server -y

After you have installed the Graylog Server, you have to generate secret key for Graylog using the following command:

### pwgen -N 1 -s 96 
MTtPFSMZxAvoLsUiXXauggyJ761hwkGn1ZTN2ovb8wN2tO1LzyeNbaatOrpLukp96p0MxwHQosmMGPbmw46ojnnSORVvr2

Now create a hash password for the root user that can be used to log in to the Graylog web server using the following command:

### echo -n Password | sha256sum
e7cf3ef4f17c3999a94f2c6f612e8bmwe46b1026878e4e19398b23cehedelicsec221a

Edit the server.conf file:

nano /etc/graylog/server/server.conf

Make changes to the file as shown below:

password_secret= MTtPFSMZxAvoLsUiXXauggyJ761hwkGn1ZTN2ovb8wN2tO1LzyeNbaatOrpLukp96p0MxwHQosmMGPborm1YRojnnSORVvr2
root_password_sha2= e7cf3ef4f17c3999a94f2c6f612e8bmwe46b1026878e4e19398b23cehedelicsec221a
[email protected]
root_timezone=UTC
elasticsearch_discovery_zen_ping_unicast_hosts = ipaddress:9300
elasticsearch_shards=1
script.inline: false
script.indexed: false
script.file: false

To enable the Graylog web interface, make changes to the file as shown below:

rest_listen_uri = http://your-server-ip:12900/
web_listen_uri = http://your-server-ip:9000/

After you have modified the configuration file, you can start Graylog Service using the following commands:

systemctl enable graylog-server
systemctl restart graylog-server

Step 6. Accessing Graylog.

Graylog will be available on HTTP port 8080 by default. Open your favorite browser and navigate to http://yourdomain.com:9000 or http://server-ip:9000 and complete the required the steps to finish the installation.
Installing-Graylog-LoginScreen
Congratulation’s! You have successfully installed Graylog. Thanks for using this tutorial for installing Graylog on Ubuntu 18.04 LTS system. For additional help or useful information, we recommend you to check the official Graylog web site.