How To Install and Use PostgreSQL on Ubuntu 20.04

How To Install and Use PostgreSQL on Ubuntu 20.04

Introduction

Relational database management systems are a key component of many web sites and applications. They provide a structured way to store, organize, and access information.

PostgreSQL, or Postgres, is a relational database management system that provides an implementation of the SQL querying language. It’s standards-compliant and has many advanced features like reliable transactions and concurrency without read locks.

This guide demonstrates how to install Postgres on an Ubuntu 20.04 server. It also provides some instructions for general database administration.

prerequisites
To follow along with this tutorial, you will need one Ubuntu 20.04 server that has been configured by following our Initial Server Setup for Ubuntu 20.04 guide. After completing this prerequisite tutorial, your server should have a non-root user with sudo permissions and a basic firewall.

Step 1 — Installing PostgreSQL

Ubuntu’s default repositories contain Postgres packages, so you can install these using the aptpackaging system.

If you’ve not done so recently, refresh your server’s local package index:

 $ sudo apt update

Then, install the Postgres package along with a -contrib package that adds some additional utilities and functionality:

  • sudo apt install postgresql postgresql-contrib

Now that the software is installed, we can go over how it works and how it may be different from other relational database management systems you may have used.

Step 2 — Using PostgreSQL Roles and Databases

By default, Postgres uses a concept called “roles” to handle authentication and authorization. These are, in some ways, similar to regular Unix-style accounts, but Postgres does not distinguish between users and groups and instead prefers the more flexible term “role”.

Upon installation, Postgres is set up to use ident authentication, meaning that it associates Postgres roles with a matching Unix/Linux system account. If a role exists within Postgres, a Unix/Linux username with the same name is able to sign in as that role.

The installation procedure created a user account called postgres that is associated with the default Postgres role. In order to use Postgres, you can log into that account.

There are a few ways to utilize this account to access Postgres.

Switching Over to the postgres Account

Switch over to the postgres account on your server by typing:

You can now access the PostgreSQL prompt immediately by typing:

From there you are free to interact with the database management system as necessary.

Exit out of the PostgreSQL prompt by typing:

This will bring you back to the postgres Linux command prompt.

Accessing a Postgres Prompt Without Switching Accounts

You can also run the command you’d like with the postgres account directly with sudo.

For instance, in the last example, you were instructed to get to the Postgres prompt by first switching to the postgres user and then running psql to open the Postgres prompt. You could do this in one step by running the single command psql as the postgres user with sudo, like this:

This will log you directly into Postgres without the intermediary bash shell in between.

Again, you can exit the interactive Postgres session by typing:

Many use cases require more than one Postgres role. Read on to learn how to configure these.

Step 3 — Creating a New Role

Currently, you just have the postgres role configured within the database. You can create new roles from the command line with the createrole command. The --interactive flag will prompt you for the name of the new role and also ask whether it should have superuser permissions.

If you are logged in as the postgres account, you can create a new user by typing:

If, instead, you prefer to use sudo for each command without switching from your normal account, type:

The script will prompt you with some choices and, based on your responses, execute the correct Postgres commands to create a user to your specifications.

Enter name of role to add: sammy
Shall the new role be a superuser? (y/n) y

You can get more control by passing some additional flags. Check out the options by looking at the man page:

  • man createuser

Your installation of Postgres now has a new user, but you have not yet added any databases. The next section describes this process.

Step 4 — Creating a New Database

Another assumption that the Postgres authentication system makes by default is that for any role used to log in, that role will have a database with the same name which it can access.

This means that if the user you created in the last section is called sammy, that role will attempt to connect to a database which is also called “sammy” by default. You can create the appropriate database with the createdb command.

If you are logged in as the postgres account, you would type something like:

  • createdb sammy

If, instead, you prefer to use sudo for each command without switching from your normal account, you would type:

 $ sudo -u postgres createdb

This flexibility provides multiple paths for creating databases as needed.

Step 5 — Opening a Postgres Prompt with the New Role

To log in with ident based authentication, you’ll need a Linux user with the same name as your Postgres role and database.

If you don’t have a matching Linux user available, you can create one with the adduser command. You will have to do this from your non-root account with sudo privileges (meaning, not logged in as the postgres user):

 $ sudo adduser

Once this new account is available, you can either switch over and connect to the database by typing:

 $ sudo -i -u
  • psql

Or, you can do this inline:

 $ sudo -u

This command will log you in automatically, assuming that all of the components have been properly configured.

If you want your user to connect to a different database, you can do so by specifying the database like this:

  • psql -d postgres

Once logged in, you can get check your current connection information by typing:

  • \conninfo
Output
You are connected to database "sammy" as user "sammy" via socket in "/var/run/postgresql" at port "5432".

This is useful if you are connecting to non-default databases or with non-default users.

Now that you know how to connect to the PostgreSQL database system, you can learn some basic Postgres management tasks.

The basic syntax for creating tables is as follows:

CREATE TABLE table_name (
    column_name1 col_type (field_length) column_constraints,
    column_name2 col_type (field_length),
    column_name3 col_type (field_length)
);

As you can see, these commands give the table a name, and then define the columns as well as the column type and the max length of the field data. You can also optionally add table constraints for each column.

You can learn more about how to create and manage tables in Postgres here.

For demonstration purposes, create the following table:

  • CREATE TABLE playground (
  • equip_id serial PRIMARY KEY,
  • type varchar (50) NOT NULL,
  • color varchar (25) NOT NULL,
  • location varchar(25) check (location in (‘north’, ‘south’, ‘west’, ‘east’, ‘northeast’, ‘southeast’, ‘southwest’, ‘northwest’)),
  • install_date date
  • );

This command will create a table that inventories playground equipment. The first column in the table will hold equipment ID numbers of the serial type, which is an auto-incrementing integer. This column also has the constraint of PRIMARY KEY which means that the values within it must be unique and not null.

The next two lines create columns for the equipment type and color respectively, neither of which can be empty. The line after these creates a location column as well as a constraint that requires the value to be one of eight possible values. The last line creates a date column that records the date on which you installed the equipment.

For two of the columns (equip_id and install_date), the command doesn’t specify a field length. The reason for this is that some data types don’t require a set length because the length or format is implied.

You can see your new table by typing:

  • \d
Output
                  List of relations
 Schema |          Name           |   Type   | Owner 
--------+-------------------------+----------+-------
 public | playground              | table    | sammy
 public | playground_equip_id_seq | sequence | sammy
(2 rows)

Your playground table is here, but there’s also something called playground_equip_id_seq that is of the type sequence. This is a representation of the serial type which you gave your equip_idcolumn. This keeps track of the next number in the sequence and is created automatically for columns of this type.

If you want to see just the table without the sequence, you can type:

  • \dt
Output
          List of relations
 Schema |    Name    | Type  | Owner 
--------+------------+-------+-------
 public | playground | table | sammy
(1 row)

With a table at the ready, let’s use it to practice managing data.

Step 7 — Adding, Querying, and Deleting Data in a Table

Now that you have a table, you can insert some data into it. As an example, add a slide and a swing by calling the table you want to add to, naming the columns and then providing data for each column, like this:

  • INSERT INTO playground (type, color, location, install_date) VALUES (‘slide’, ‘blue’, ‘south’, ‘2017-04-28’);
  • INSERT INTO playground (type, color, location, install_date) VALUES (‘swing’, ‘yellow’, ‘northwest’, ‘2018-08-16’);

You should take care when entering the data to avoid a few common hangups. For one, do not wrap the column names in quotation marks, but the column values that you enter do need quotes.

Another thing to keep in mind is that you do not enter a value for the equip_id column. This is because this is automatically generated whenever you add a new row to the table.

Retrieve the information you’ve added by typing:

  • SELECT * FROM playground;
Output
 equip_id | type  | color  | location  | install_date 
----------+-------+--------+-----------+--------------
        1 | slide | blue   | south     | 2017-04-28
        2 | swing | yellow | northwest | 2018-08-16
(2 rows)

Here, you can see that your equip_id has been filled in successfully and that all of your other data has been organized correctly.

If the slide on the playground breaks and you have to remove it, you can also remove the row from your table by typing:

  • DELETE FROM playground WHERE type = ‘slide’;

Query the table again:

  • SELECT * FROM playground;
Output
 equip_id | type  | color  | location  | install_date 
----------+-------+--------+-----------+--------------
        2 | swing | yellow | northwest | 2018-08-16
(1 row)

Notice that the slide row is no longer a part of the table.

Step 8 — Adding and Deleting Columns from a Table

After creating a table, you can modify it by adding or removing columns. Add a column to show the last maintenance visit for each piece of equipment by typing:

  • ALTER TABLE playground ADD last_maint date;

If you view your table information again, you will see the new column has been added but no data has been entered:

  • SELECT * FROM playground;
Output
 equip_id | type  | color  | location  | install_date | last_maint 
----------+-------+--------+-----------+--------------+------------
        2 | swing | yellow | northwest | 2018-08-16   | 
(1 row)

If you find that your work crew uses a separate tool to keep track of maintenance history, you can delete of the column by typing:

  • ALTER TABLE playground DROP last_maint;

This deletes the last_maint column and any values found within it, but leaves all the other data intact.

Step 9 — Updating Data in a Table

So far, you’ve learned how to add records to a table and how to delete them, but this tutorial hasn’t yet covered how to modify existing entries.

You can update the values of an existing entry by querying for the record you want and setting the column to the value you wish to use. You can query for the swing record (this will match everyswing in your table) and change its color to red. This could be useful if you gave the swing set a paint job:

  • UPDATE playground SET color = ‘red’ WHERE type = ‘swing’;

You can verify that the operation was successful by querying the data again:

  • SELECT * FROM playground;
Output
 equip_id | type  | color | location  | install_date 
----------+-------+-------+-----------+--------------
        2 | swing | red   | northwest | 2018-08-16
(1 row)

As you can see, the slide is now registered as being red.

Conclusion

You are now set up with PostgreSQL on your Ubuntu 20.04 server. If you’d like to learn more about Postgres and how to use it, we encourage you to check out the following guides:

How To Install Elasticsearch, Logstash, and Kibana (Elastic Stack) on Ubuntu 20.04

Introduction

The Elastic Stack — formerly known as the ELK Stack — is a collection of open-source software produced by Elastic which allows you to search, analyze, and visualize logs generated from any source in any format, a practice known as centralized logging. Centralized logging can be useful when attempting to identify problems with your servers or applications as it allows you to search through all of your logs in a single place. It’s also useful because it allows you to identify issues that span multiple servers by correlating their logs during a specific time frame.

The Elastic Stack has four main components:

  • Elasticsearch: a distributed RESTful search engine which stores all of the collected data.
  • Logstash: the data processing component of the Elastic Stack which sends incoming data to Elasticsearch.
  • Kibana: a web interface for searching and visualizing logs.
  • Beats: lightweight, single-purpose data shippers that can send data from hundreds or thousands of machines to either Logstash or Elasticsearch.

In this tutorial, you will install the Elastic Stack on an Ubuntu 20.04 server. You will learn how to install all of the components of the Elastic Stack — including Filebeat, a Beat used for forwarding and centralizing logs and files — and configure them to gather and visualize system logs. Additionally, because Kibana is normally only available on the localhost, we will use Nginx to proxy it so it will be accessible over a web browser. We will install all of these components on a single server, which we will refer to as our Elastic Stack server.

Note: When installing the Elastic Stack, you must use the same version across the entire stack. In this tutorial we will install the latest versions of the entire stack which are, at the time of this writing, Elasticsearch 7.7.1, Kibana 7.7.1, Logstash 7.7.1, and Filebeat 7.7.1.

Prerequisites

To complete this tutorial, you will need the following:

Additionally, because the Elastic Stack is used to access valuable information about your server that you would not want unauthorized users to access, it’s important that you keep your server secure by installing a TLS/SSL certificate. This is optional but strongly encouraged.

However, because you will ultimately make changes to your Nginx server block over the course of this guide, it would likely make more sense for you to complete the Let’s Encrypt on Ubuntu 20.04guide at the end of this tutorial’s second step. With that in mind, if you plan to configure Let’s Encrypt on your server, you will need the following in place before doing so:

  • A fully qualified domain name (FQDN). This tutorial will use your_domain throughout. You can purchase a domain name on Namecheap, get one for free on Freenom, or use the domain registrar of your choice.
  • Both of the following DNS records set up for your server. You can follow this introduction to DigitalOcean DNS for details on how to add them.
    • An A record with your_domain pointing to your server’s public IP address.
    • An A record with www.your_domain pointing to your server’s public IP address.

Step 1 — Installing and Configuring Elasticsearch

The Elasticsearch components are not available in Ubuntu’s default package repositories. They can, however, be installed with APT after adding Elastic’s package source list.

All of the packages are signed with the Elasticsearch signing key in order to protect your system from package spoofing. Packages which have been authenticated using the key will be considered trusted by your package manager. In this step, you will import the Elasticsearch public GPG key and add the Elastic package source list in order to install Elasticsearch.

To begin, use cURL, the command line tool for transferring data with URLs, to import the Elasticsearch public GPG key into APT. Note that we are using the arguments -fsSL to silence all progress and possible errors (except for a server failure) and to allow cURL to make a request on a new location if redirected. Pipe the output of the cURL command into the apt-key program, which adds the public GPG key to APT.

    $ curl -fsSL https://artifacts.elastic.co/GPG-KEY-elasticsearch | sudo apt-key add -

Next, add the Elastic source list to the sources.list.d directory, where APT will search for new sources:

  • echo "deb https://artifacts.elastic.co/packages/7.x/apt stable main" | sudo tee -a /etc/apt/sources.list.d/elastic-7.x.list

Next, update your package lists so APT will read the new Elastic source:

  • sudo apt update

Then install Elasticsearch with this command:

  • sudo apt install elasticsearch

Elasticsearch is now installed and ready to be configured. Use your preferred text editor to edit Elasticsearch’s main configuration file, elasticsearch.yml. Here, we’ll use nano:

  • sudo nano /etc/elasticsearch/elasticsearch.yml

Note: Elasticsearch’s configuration file is in YAML format, which means that we need to maintain the indentation format. Be sure that you do not add any extra spaces as you edit this file.

The elasticsearch.yml file provides configuration options for your cluster, node, paths, memory, network, discovery, and gateway. Most of these options are preconfigured in the file but you can change them according to your needs. For the purposes of our demonstration of a single-server configuration, we will only adjust the settings for the network host.

Elasticsearch listens for traffic from everywhere on port 9200. You will want to restrict outside access to your Elasticsearch instance to prevent outsiders from reading your data or shutting down your Elasticsearch cluster through its REST API. To restrict access and therefore increase security, find the line that specifies network.host, uncomment it, and replace its value with localhost like this:

/etc/elasticsearch/elasticsearch.yml
. . .
# ---------------------------------- Network -----------------------------------
#
# Set the bind address to a specific IP (IPv4 or IPv6):
#
network.host: localhost
. . .

We have specified localhost so that Elasticsearch listens on all interfaces and bound IPs. If you want it to listen only on a specific interface, you can specify its IP in place of localhost. Save and close elasticsearch.yml. If you’re using nano, you can do so by pressing CTRL+X, followed by Yand then ENTER .

These are the minimum settings you can start with in order to use Elasticsearch. Now you can start Elasticsearch for the first time.

Start the Elasticsearch service with systemctl. Give Elasticsearch a few moments to start up. Otherwise, you may get errors about not being able to connect.

  • sudo systemctl start elasticsearch

Next, run the following command to enable Elasticsearch to start up every time your server boots:

  • sudo systemctl enable elasticsearch

You can test whether your Elasticsearch service is running by sending an HTTP request:

  • curl -X GET "localhost:9200"

You will see a response showing some basic information about your local node, similar to this:

Output
{
  "name" : "Elasticsearch",
  "cluster_name" : "elasticsearch",
  "cluster_uuid" : "qqhFHPigQ9e2lk-a7AvLNQ",
  "version" : {
    "number" : "7.7.1",
    "build_flavor" : "default",
    "build_type" : "deb",
    "build_hash" : "ef48eb35cf30adf4db14086e8aabd07ef6fb113f",
    "build_date" : "2020-03-26T06:34:37.794943Z",
    "build_snapshot" : false,
    "lucene_version" : "8.5.1",
    "minimum_wire_compatibility_version" : "6.8.0",
    "minimum_index_compatibility_version" : "6.0.0-beta1"
  },
  "tagline" : "You Know, for Search"
}

Now that Elasticsearch is up and running, let’s install Kibana, the next component of the Elastic Stack.

Step 2 — Installing and Configuring the Kibana Dashboard

According to the official documentation, you should install Kibana only after installing Elasticsearch. Installing in this order ensures that the components each product depends on are correctly in place.

Because you’ve already added the Elastic package source in the previous step, you can just install the remaining components of the Elastic Stack using apt:

  • sudo apt install kibana

Then enable and start the Kibana service:

  • sudo systemctl enable kibana
  • sudo systemctl start kibana

Because Kibana is configured to only listen on localhost, we must set up a reverse proxy to allow external access to it. We will use Nginx for this purpose, which should already be installed on your server.

First, use the openssl command to create an administrative Kibana user which you’ll use to access the Kibana web interface. As an example we will name this account kibanaadmin, but to ensure greater security we recommend that you choose a non-standard name for your user that would be difficult to guess.

The following command will create the administrative Kibana user and password, and store them in the htpasswd.users file. You will configure Nginx to require this username and password and read this file momentarily:

  • echo "kibanaadmin:`openssl passwd -apr1`" | sudo tee -a /etc/nginx/htpasswd.users

Enter and confirm a password at the prompt. Remember or take note of this login, as you will need it to access the Kibana web interface.

Next, we will create an Nginx server block file. As an example, we will refer to this file as your_domain, although you may find it helpful to give yours a more descriptive name. For instance, if you have a FQDN and DNS records set up for this server, you could name this file after your FQDN.

Using nano or your preferred text editor, create the Nginx server block file:

  • sudo nano /etc/nginx/sites-available/your_domain

Add the following code block into the file, being sure to update your_domain to match your server’s FQDN or public IP address. This code configures Nginx to direct your server’s HTTP traffic to the Kibana application, which is listening on localhost:5601. Additionally, it configures Nginx to read the htpasswd.users file and require basic authentication.

Note that if you followed the prerequisite Nginx tutorial through to the end, you may have already created this file and populated it with some content. In that case, delete all the existing content in the file before adding the following:

/etc/nginx/sites-available/your_domain
server {
    listen 80;

    server_name your_domain;

    auth_basic "Restricted Access";
    auth_basic_user_file /etc/nginx/htpasswd.users;

    location / {
        proxy_pass http://localhost:5601;
        proxy_http_version 1.1;
        proxy_set_header Upgrade $http_upgrade;
        proxy_set_header Connection 'upgrade';
        proxy_set_header Host $host;
        proxy_cache_bypass $http_upgrade;
    }
}

When you’re finished, save and close the file.

Next, enable the new configuration by creating a symbolic link to the sites-enabled directory. If you already created a server block file with the same name in the Nginx prerequisite, you do not need to run this command:

  • sudo ln -s /etc/nginx/sites-available/your_domain /etc/nginx/sites-enabled/your_domain

Then check the configuration for syntax errors:

  • sudo nginx -t

If any errors are reported in your output, go back and double check that the content you placed in your configuration file was added correctly. Once you see syntax is ok in the output, go ahead and restart the Nginx service:

  • sudo systemctl reload nginx

If you followed the initial server setup guide, you should have a UFW firewall enabled. To allow connections to Nginx, we can adjust the rules by typing:

  • sudo ufw allow 'Nginx Full'

Note: If you followed the prerequisite Nginx tutorial, you may have created a UFW rule allowing the Nginx HTTP profile through the firewall. Because the Nginx Full profile allows both HTTP and HTTPS traffic through the firewall, you can safely delete the rule you created in the prerequisite tutorial. Do so with the following command:

  • sudo ufw delete allow 'Nginx HTTP'


Kibana is now accessible via your FQDN or the public IP address of your Elastic Stack server. You can check the Kibana server’s status page by navigating to the following address and entering your login credentials when prompted:

http://your_domain/status

This status page displays information about the server’s resource usage and lists the installed plugins.

|Kibana status page

Note: As mentioned in the Prerequisites section, it is recommended that you enable SSL/TLS on your server. You can follow the Let’s Encrypt guide now to obtain a free SSL certificate for Nginx on Ubuntu 20.04. After obtaining your SSL/TLS certificates, you can come back and complete this tutorial.

Now that the Kibana dashboard is configured, let’s install the next component: Logstash.

Step 3 — Installing and Configuring Logstash

Although it’s possible for Beats to send data directly to the Elasticsearch database, it is common to use Logstash to process the data. This will allow you more flexibility to collect data from different sources, transform it into a common format, and export it to another database.

Install Logstash with this command:

  • sudo apt install logstash

After installing Logstash, you can move on to configuring it. Logstash’s configuration files reside in the /etc/logstash/conf.d directory. For more information on the configuration syntax, you can check out the configuration reference that Elastic provides. As you configure the file, it’s helpful to think of Logstash as a pipeline which takes in data at one end, processes it in one way or another, and sends it out to its destination (in this case, the destination being Elasticsearch). A Logstash pipeline has two required elements, input and output, and one optional element, filter. The input plugins consume data from a source, the filter plugins process the data, and the output plugins write the data to a destination.

Logstash pipeline

Create a configuration file called 02-beats-input.conf where you will set up your Filebeat input:

  • sudo nano /etc/logstash/conf.d/02-beats-input.conf

Insert the following input configuration. This specifies a beats input that will listen on TCP port 5044.

/etc/logstash/conf.d/02-beats-input.conf
input {
  beats {
    port => 5044
  }
}

Save and close the file.

Next, create a configuration file called 30-elasticsearch-output.conf:

  • sudo nano /etc/logstash/conf.d/30-elasticsearch-output.conf

Insert the following output configuration. Essentially, this output configures Logstash to store the Beats data in Elasticsearch, which is running at localhost:9200, in an index named after the Beat used. The Beat used in this tutorial is Filebeat:

/etc/logstash/conf.d/30-elasticsearch-output.conf
output {
  if [@metadata][pipeline] {
    elasticsearch {
    hosts => ["localhost:9200"]
    manage_template => false
    index => "%{[@metadata][beat]}-%{[@metadata][version]}-%{+YYYY.MM.dd}"
    pipeline => "%{[@metadata][pipeline]}"
    }
  } else {
    elasticsearch {
    hosts => ["localhost:9200"]
    manage_template => false
    index => "%{[@metadata][beat]}-%{[@metadata][version]}-%{+YYYY.MM.dd}"
    }
  }
}

Save and close the file.

Test your Logstash configuration with this command:

  • sudo -u logstash /usr/share/logstash/bin/logstash --path.settings /etc/logstash -t

If there are no syntax errors, your output will display Config Validation Result: OK. Exiting Logstash after a few seconds. If you don’t see this in your output, check for any errors noted in your output and update your configuration to correct them. Note that you will receive warnings from OpenJDK, but they should not cause any problems and can be ignored.

If your configuration test is successful, start and enable Logstash to put the configuration changes into effect:

  • sudo systemctl start logstash
  • sudo systemctl enable logstash

Now that Logstash is running correctly and is fully configured, let’s install Filebeat.

Step 4 — Installing and Configuring Filebeat

The Elastic Stack uses several lightweight data shippers called Beats to collect data from various sources and transport them to Logstash or Elasticsearch. Here are the Beats that are currently available from Elastic:

  • Filebeat: collects and ships log files.
  • Metricbeat: collects metrics from your systems and services.
  • Packetbeat: collects and analyzes network data.
  • Winlogbeat: collects Windows event logs.
  • Auditbeat: collects Linux audit framework data and monitors file integrity.
  • Heartbeat: monitors services for their availability with active probing.

In this tutorial we will use Filebeat to forward local logs to our Elastic Stack.

Install Filebeat using apt:

  • sudo apt install filebeat

Next, configure Filebeat to connect to Logstash. Here, we will modify the example configuration file that comes with Filebeat.

Open the Filebeat configuration file:

  • sudo nano /etc/filebeat/filebeat.yml

Note: As with Elasticsearch, Filebeat’s configuration file is in YAML format. This means that proper indentation is crucial, so be sure to use the same number of spaces that are indicated in these instructions.

Filebeat supports numerous outputs, but you’ll usually only send events directly to Elasticsearch or to Logstash for additional processing. In this tutorial, we’ll use Logstash to perform additional processing on the data collected by Filebeat. Filebeat will not need to send any data directly to Elasticsearch, so let’s disable that output. To do so, find the output.elasticsearch section and comment out the following lines by preceding them with a #:

/etc/filebeat/filebeat.yml
...
#output.elasticsearch:
  # Array of hosts to connect to.
  #hosts: ["localhost:9200"]
...

Then, configure the output.logstash section. Uncomment the lines output.logstash: and hosts: ["localhost:5044"] by removing the #. This will configure Filebeat to connect to Logstash on your Elastic Stack server at port 5044, the port for which we specified a Logstash input earlier:

/etc/filebeat/filebeat.yml
output.logstash:
  # The Logstash hosts
  hosts: ["localhost:5044"]

Save and close the file.

The functionality of Filebeat can be extended with Filebeat modules. In this tutorial we will use the system module, which collects and parses logs created by the system logging service of common Linux distributions.

Let’s enable it:

  • sudo filebeat modules enable system

You can see a list of enabled and disabled modules by running:

  • sudo filebeat modules list

You will see a list similar to the following:

Output
Enabled:
system

Disabled:
apache2
auditd
elasticsearch
icinga
iis
kafka
kibana
logstash
mongodb
mysql
nginx
osquery
postgresql
redis
traefik
...

By default, Filebeat is configured to use default paths for the syslog and authorization logs. In the case of this tutorial, you do not need to change anything in the configuration. You can see the parameters of the module in the /etc/filebeat/modules.d/system.yml configuration file.

Next, we need to set up the Filebeat ingest pipelines, which parse the log data before sending it through logstash to Elasticsearch. To load the ingest pipeline for the system module, enter the following command:

  • sudo filebeat setup --pipelines --modules system

Next, load the index template into Elasticsearch. An Elasticsearch index is a collection of documents that have similar characteristics. Indexes are identified with a name, which is used to refer to the index when performing various operations within it. The index template will be automatically applied when a new index is created.

To load the template, use the following command:

  • sudo filebeat setup --index-management -E output.logstash.enabled=false -E 'output.elasticsearch.hosts=["localhost:9200"]'
Output
Index setup finished.

Filebeat comes packaged with sample Kibana dashboards that allow you to visualize Filebeat data in Kibana. Before you can use the dashboards, you need to create the index pattern and load the dashboards into Kibana.

As the dashboards load, Filebeat connects to Elasticsearch to check version information. To load dashboards when Logstash is enabled, you need to disable the Logstash output and enable Elasticsearch output:

  • sudo filebeat setup -E output.logstash.enabled=false -E output.elasticsearch.hosts=['localhost:9200'] -E setup.kibana.host=localhost:5601

You should receive output similar to this:

Output
Overwriting ILM policy is disabled. Set `setup.ilm.overwrite:true` for enabling.

Index setup finished.
Loading dashboards (Kibana must be running and reachable)
Loaded dashboards
Setting up ML using setup --machine-learning is going to be removed in 8.0.0. Please use the ML app instead.
See more: https://www.elastic.co/guide/en/elastic-stack-overview/current/xpack-ml.html
Loaded machine learning job configurations
Loaded Ingest pipelines

Now you can start and enable Filebeat:

  • sudo systemctl start filebeat
  • sudo systemctl enable filebeat

If you’ve set up your Elastic Stack correctly, Filebeat will begin shipping your syslog and authorization logs to Logstash, which will then load that data into Elasticsearch.

To verify that Elasticsearch is indeed receiving this data, query the Filebeat index with this command:

  • curl -XGET 'http://localhost:9200/filebeat-*/_search?pretty'

You should receive output similar to this:

Output
...
{
{
  "took" : 4,
  "timed_out" : false,
  "_shards" : {
    "total" : 2,
    "successful" : 2,
    "skipped" : 0,
    "failed" : 0
  },
  "hits" : {
    "total" : {
      "value" : 4040,
      "relation" : "eq"
    },
    "max_score" : 1.0,
    "hits" : [
      {
        "_index" : "filebeat-7.7.1-2020.06.04",
        "_type" : "_doc",
        "_id" : "FiZLgXIB75I8Lxc9ewIH",
        "_score" : 1.0,
        "_source" : {
          "cloud" : {
            "provider" : "digitalocean",
            "instance" : {
              "id" : "194878454"
            },
            "region" : "nyc1"
          },
          "@timestamp" : "2020-06-04T21:45:03.995Z",
          "agent" : {
            "version" : "7.7.1",
            "type" : "filebeat",
            "ephemeral_id" : "cbcefb9a-8d15-4ce4-bad4-962a80371ec0",
            "hostname" : "june-ubuntu-20-04-elasticstack",
            "id" : "fbd5956f-12ab-4227-9782-f8f1a19b7f32"
          },


...

If your output shows 0 total hits, Elasticsearch is not loading any logs under the index you searched for, and you will need to review your setup for errors. If you received the expected output, continue to the next step, in which we will see how to navigate through some of Kibana’s dashboards.

Step 5 — Exploring Kibana Dashboards

Let’s return to the Kibana web interface that we installed earlier.

In a web browser, go to the FQDN or public IP address of your Elastic Stack server. If your session has been interrupted, you will need to re-enter entering the credentials you defined in Step 2. Once you have logged in, you should receive the Kibana homepage:

Kibana Homepage

Click the Discover link in the left-hand navigation bar (you may have to click the the Expand icon at the very bottom left to see the navigation menu items). On the Discover page, select the predefined filebeat-* index pattern to see Filebeat data. By default, this will show you all of the log data over the last 15 minutes. You will see a histogram with log events, and some log messages below:

Discover page

Here, you can search and browse through your logs and also customize your dashboard. At this point, though, there won’t be much in there because you are only gathering syslogs from your Elastic Stack server.

Use the left-hand panel to navigate to the Dashboard page and search for the Filebeat Systemdashboards. Once there, you can select the sample dashboards that come with Filebeat’s systemmodule.

For example, you can view detailed stats based on your syslog messages:

Syslog Dashboard

You can also view which users have used the sudo command and when:

Sudo Dashboard

Kibana has many other features, such as graphing and filtering, so feel free to explore.

Conclusion

In this tutorial, you’ve learned how to install and configure the Elastic Stack to collect and analyze system logs. Remember that you can send just about any type of log or indexed data to Logstash using Beats, but the data becomes even more useful if it is parsed and structured with a Logstash filter, as this transforms the data into a consistent format that can be read easily by Elasticsearch.

How To Install Git from Source on Ubuntu 20.04 [Quickstart]

Introduction

Version control systems help you collaborate on software development projects. Git is one of the most popular version control systems currently available.

This tutorial will walk you through installing and configuring Git from source on an Ubuntu 20.04 server. For a more detailed version of this tutorial, with more thorough explanations of each step, please refer to How To Install Git on Ubuntu 20.04.

Step 1 — Confirm Git Preinstallation

Verify whether you have a version of Git currently installed on the server:

  • git –version

If Git is installed, you’ll receive output similar to the following:

Output
git version 2.25.1

Whether or not you have Git installed already, it is worth checking to make sure that you install a more recent version during this process.

Step 2 — Update and Install Dependencies

You’ll next need to install the software that Git depends on. This is all available in the default Ubuntu repositories, so we can update our local package index and then install the relevant packages.

  • sudo apt update
  • sudo apt install libz-dev libssl-dev libcurl4-gnutls-dev libexpat1-dev gettext cmake gcc

Press y to confirm if prompted. Necessary dependencies should now be installed.

Step 3 — Install Tarball

Create a temporary directory to download our Git tarball and move into it.

  • mkdir tmp
  • cd /tmp

From the Git project website, we can navigate to the tarball list available at https://mirrors.edge.kernel.org/pub/software/scm/git/ and download the version you would like. At the time of writing, the most recent version is 2.26.2, so we will download that for demonstration purposes. We’ll use curl and output the file we download to git.tar.gz.

  • curl -o git.tar.gz https://mirrors.edge.kernel.org/pub/software/scm/git/git-2.26.2.tar.gz

Step 4 — Unpack Compressed File and Install the Package

Unpack the compressed tarball file:

  • tar -zxf git.tar.gz

Next, move into the new Git directory:

  • cd git-*

Now, you can make the package and install it by typing these two commands:

  • make prefix=/usr/local all
  • sudo make prefix=/usr/local install

Now, replace the shell process so that the version of Git we just installed will be used:

  • exec bash

Step 5 — Verify New Version of Git

You can be sure that your install was successful by checking the version.

  • git –version
Output
git version 2.26.2

With Git successfully installed, you can now complete your setup.

Step 6 — Set Up Git

Now that you have Git installed and to prevent warnings, you should configure it with your information.

  • git config –global user.name “Your Name
  • git config –global user.email “[email protected]

If you need to edit this file, you can use a text editor such as nano:

  • nano ~/.gitconfig
~/.gitconfig contents
[user]
  name = Your Name
  email = [email protected]

To learn more about how to use Git, check out these articles and series:

How To Install Docker Compose on Ubuntu 20.04 [Quickstart]

Introduction

In this quickstart guide, we’ll install Docker Compose on an Ubuntu 20.04 server.

For a more detailed version of this tutorial, with more explanations of each step, please refer to How To Install and Use Docker Compose on Ubuntu 20.04.

Prerequisites

To follow this guide, you’ll need access to an Ubuntu 20.04 server or local machine as a sudo user, and Docker installed on this system.

Step 1 — Download Docker Compose

Start by confirming the most recent Docker Compose release available in their releases page. At the time of this writing, the most current stable version is 1.26.0.

Run the following command to download Docker Compose and make this software globally accessible on your system as docker-compose:

  • sudo curl -L "https://github.com/docker/compose/releases/download/1.26.0/docker-compose-$(uname -s)-$(uname -m)" -o /usr/local/bin/docker-compose

Step 2 — Set Up Executable Permissions

Next, set the correct permissions to make sure the docker-compose command is executable:

  • sudo chmod +x /usr/local/bin/docker-compose

To verify that the installation was successful, run:

  • docker-compose –version

You’ll see output similar to this:

Output
docker-compose version 1.26.0, build 8a1c60f6

Docker Compose is now successfully installed on your system.

Here are links to more detailed guides related to this tutorial:

How To Install and Configure Zabbix to Securely Monitor Remote Servers on Ubuntu 20.04

The author selected the Computer History Museum to receive a donation as part of the Write for DOnations program.

Introduction

Zabbix is open-source monitoring software for networks and applications. It offers real-time monitoring of thousands of metrics collected from servers, virtual machines, network devices, and web applications. These metrics can help you determine the current health of your IT infrastructure and detect problems with hardware or software components before customers complain. Useful information is stored in a database so you can analyze data over time and improve the quality of provided services or plan upgrades of your equipment.

Zabbix uses several options for collecting metrics, including agentless monitoring of user services and client-server architecture. To collect server metrics, it uses a small agent on the monitored client to gather data and send it to the Zabbix server. Zabbix supports encrypted communication between the server and connected clients, so your data is protected while it travels over insecure networks.

The Zabbix server stores its data in a relational database powered by MySQL or PostgreSQL. You can also store historical data in NoSQL databases like Elasticsearch and TimescaleDB. Zabbix provides a web interface so you can view data and configure system settings.

In this tutorial, you will configure Zabbix on two Ubuntu 20.04 machines. One will be configured as the Zabbix server, and the other as a client that you’ll monitor. The Zabbix server will use a MySQL database to record monitoring data and use Nginx to serve the web interface.

Prerequisites

To follow this tutorial, you will need:

  • Two Ubuntu 20.04 servers set up by following the Initial Server Setup Guide for Ubuntu 20.04, including a non-root user with sudo privileges and a firewall configured with ufw. On one server, you will install Zabbix; this tutorial will refer to this as the Zabbix server. It will monitor your second server; this second server will be referred to as the second Ubuntu server.
  • The server that will run the Zabbix server needs Nginx, MySQL, and PHP installed. Follow Steps 1–3 of our Ubuntu 20.04 LEMP Stack guide to configure those on your Zabbix server.
  • A registered domain name. This tutorial will use your_domain throughout. You can purchase a domain name from Namecheap, get one for free with Freenom, or use the domain registrar of your choice.
  • Both of the following DNS records set up for your Zabbix server. If you are using DigitalOcean, please see our DNS documentation for details on how to add them.
    • An A record with your_domain pointing to your Zabbix server’s public IP address.
    • An A record with www.your_domain pointing to your Zabbix server’s public IP address.

Additionally, because the Zabbix Server is used to access valuable information about your infrastructure that you would not want unauthorized users to access, it’s important that you keep your server secure by installing a TLS/SSL certificate. This is optional but strongly encouraged. If you would like to secure your server, follow the Let’s Encrypt on Ubuntu 20.04 guide after Step 3 of this tutorial.

Step 1 — Installing the Zabbix Server

First, you need to install Zabbix on the server where you installed MySQL, Nginx, and PHP. Log in to this machine as your non-root user:

  • ssh sammy@zabbix_server_ip_address

Zabbix is available in Ubuntu’s package manager, but it’s outdated, so use the official Zabbix repository to install the latest stable version. Download and install the repository configuration package:

  • wget https://repo.zabbix.com/zabbix/5.0/ubuntu/pool/main/z/zabbix-release/zabbix-release_5.0-1+focal_all.deb
  • sudo dpkg -i zabbix-release_5.0-1+focal_all.deb

You will see the following output:

Output
Selecting previously unselected package zabbix-release.
(Reading database ... 64058 files and directories currently installed.)
Preparing to unpack zabbix-release_5.0-1+focal_all.deb ...
Unpacking zabbix-release (1:5.0-1+focal) ...
Setting up zabbix-release (1:5.0-1+focal) ...

Update the package index so the new repository is included:

  • sudo apt update

Then install the Zabbix server and web frontend with MySQL database support:

  • sudo apt install zabbix-server-mysql zabbix-frontend-php

Also, install the Zabbix agent, which will let you collect data about the Zabbix server status itself.

  • sudo apt install zabbix-agent

Before you can use Zabbix, you have to set up a database to hold the data that the Zabbix server will collect from its agents. You can do this in the next step.

Step 2 — Configuring the MySQL Database for Zabbix

You need to create a new MySQL database and populate it with some basic information in order to make it suitable for Zabbix. You’ll also create a specific user for this database so Zabbix isn’t logging in to MySQL with the root account.

Log in to MySQL as the root user:

  • sudo mysql

Create the Zabbix database with UTF-8 character support:

  • create database zabbix character set utf8 collate utf8_bin;

Then create a user that the Zabbix server will use, give it access to the new database, and set the password for the user:

  • create user zabbix@localhost identified by ‘your_zabbix_mysql_password‘;
  • grant all privileges on zabbix.* to zabbix@localhost;

That takes care of the user and the database. Exit out of the database console.

  • quit;

Next you have to import the initial schema and data. The Zabbix installation provided you with a file that sets this up.

Run the following command to set up the schema and import the data into the zabbix database. Use zcat since the data in the file is compressed:

  • zcat /usr/share/doc/zabbix-server-mysql*/create.sql.gz | mysql -uzabbix -p zabbix

Enter the password for the zabbix MySQL user that you configured when prompted.

This command may take a minute or two to execute. If you see the error ERROR 1045 (28000): Access denied for userzabbix@'localhost' (using password: YES) then make sure you used the right password for the zabbix user.

In order for the Zabbix server to use this database, you need to set the database password in the Zabbix server configuration file. Open the configuration file in your preferred text editor. This tutorial will use nano:

  • sudo nano /etc/zabbix/zabbix_server.conf

Look for the following section of the file:

/etc/zabbix/zabbix_server.conf
...
### Option: DBPassword                           
#       Database password. Ignored for SQLite.   
#       Comment this line if no password is used.
#                                                
# Mandatory: no                                  
# Default:                                       
# DBPassword=
...

These comments in the file explain how to connect to the database. You need to set the DBPassword value in the file to the password for your database user. Add this line after those comments to configure the database:

/etc/zabbix/zabbix_server.conf
...
DBPassword=your_zabbix_mysql_password
...

Save and close zabbix_server.conf by pressing CTRL+X, followed by Y and then ENTER if you’re using nano.

You’ve now configured the Zabbix server to connect to the database. Next, you will configure the Nginx web server to serve the Zabbix frontend.

Step 3 — Configuring Nginx for Zabbix

To configure Nginx automatically, install the automatic configuration package:

  • sudo apt install zabbix-nginx-conf

As a result, you will get the configuration file /etc/zabbix/nginx.conf, as well as a link to it in the Nginx configuration directory /etc/nginx/conf.d/zabbix.conf.

Next, you need to make changes to this file. Open the configuration file:

  • sudo nano /etc/zabbix/nginx.conf

The file contains an automatically generated Nginx server block configuration. It contains two lines that determine the server name and what port it is listening on:

/etc/zabbix/nginx.conf
server {
#        listen          80;
#        server_name     example.com;
...

Uncomment the two lines, and replace example.com with your domain name. Your settings will look like this:

/etc/zabbix/nginx.conf
server {
        listen          80;
        server_name     your_domain;
...

Save and close the file. Next, test to make sure that there are no syntax errors in any of your Nginx files and reload the configuration:

  • sudo nginx -t
  • sudo nginx -s reload

Now that Nginx is set up to serve the Zabbix frontend, you will make some modifications to your PHP setup in order for the Zabbix web interface to work properly.

Note: As mentioned in the Prerequisites section, it is recommended that you enable SSL/TLS on your server. If you would like to do this, follow our Ubuntu 20.04 Let’s Encrypt tutorial before you move on to Step 4 to obtain a free SSL certificate for Nginx. This process will automatically detect your Zabbix server block and configure it for HTTPS. After obtaining your SSL/TLS certificates, you can come back and complete this tutorial.

Step 4 — Configuring PHP for Zabbix

The Zabbix web interface is written in PHP and requires some special PHP server settings. The Zabbix installation process created a PHP-FPM configuration file that contains these settings. It is located in the directory /etc/zabbix and is loaded automatically by PHP-FPM. You need to make a small change to this file, so open it up with the following:

  • sudo nano /etc/zabbix/php-fpm.conf

The file contains PHP settings that meet the necessary requirements for the Zabbix web interface. However, the timezone setting is commented out by default. To make sure that Zabbix uses the correct time, you need to set the appropriate timezone:

/etc/zabbix/php-fpm.conf
...
php_value[max_execution_time] = 300
php_value[memory_limit] = 128M
php_value[post_max_size] = 16M
php_value[upload_max_filesize] = 2M
php_value[max_input_time] = 300
php_value[max_input_vars] = 10000
; php_value[date.timezone] = Europe/Riga

Uncomment the timezone line highlighted in the preceding code block and change it to your timezone. You can use this list of supported time zones to find the right one for you. Then save and close the file.

Now restart PHP-FPM to apply these new settings:

  • sudo systemctl restart php7.4-fpm.service

You can now start the Zabbix server:

  • sudo systemctl start zabbix-server

Then check whether the Zabbix server is running properly:

  • sudo systemctl status zabbix-server

You will see the following status:

Output
● zabbix-server.service - Zabbix Server
     Loaded: loaded (/lib/systemd/system/zabbix-server.service; disabled; vendor preset: enabled)
     Active: active (running) since Fri 2020-06-12 05:59:32 UTC; 36s ago
    Process: 27026 ExecStart=/usr/sbin/zabbix_server -c $CONFFILE (code=exited, status=0/SUCCESS)
  ...

Finally, enable the server to start at boot time:

  • sudo systemctl enable zabbix-server

The server is set up and connected to the database. Next, set up the web frontend.

Step 5 — Configuring Settings for the Zabbix Web Interface

The web interface lets you see reports and add hosts that you want to monitor, but it needs some initial setup before you can use it. Launch your browser and go to the address http://zabbix_server_name or https://zabbix_server_name if you set up Let’s Encrypt. On the first screen, you will see a welcome message. Click Next step to continue.

On the next screen, you will see the table that lists all of the prerequisites to run Zabbix.

Prerequisites

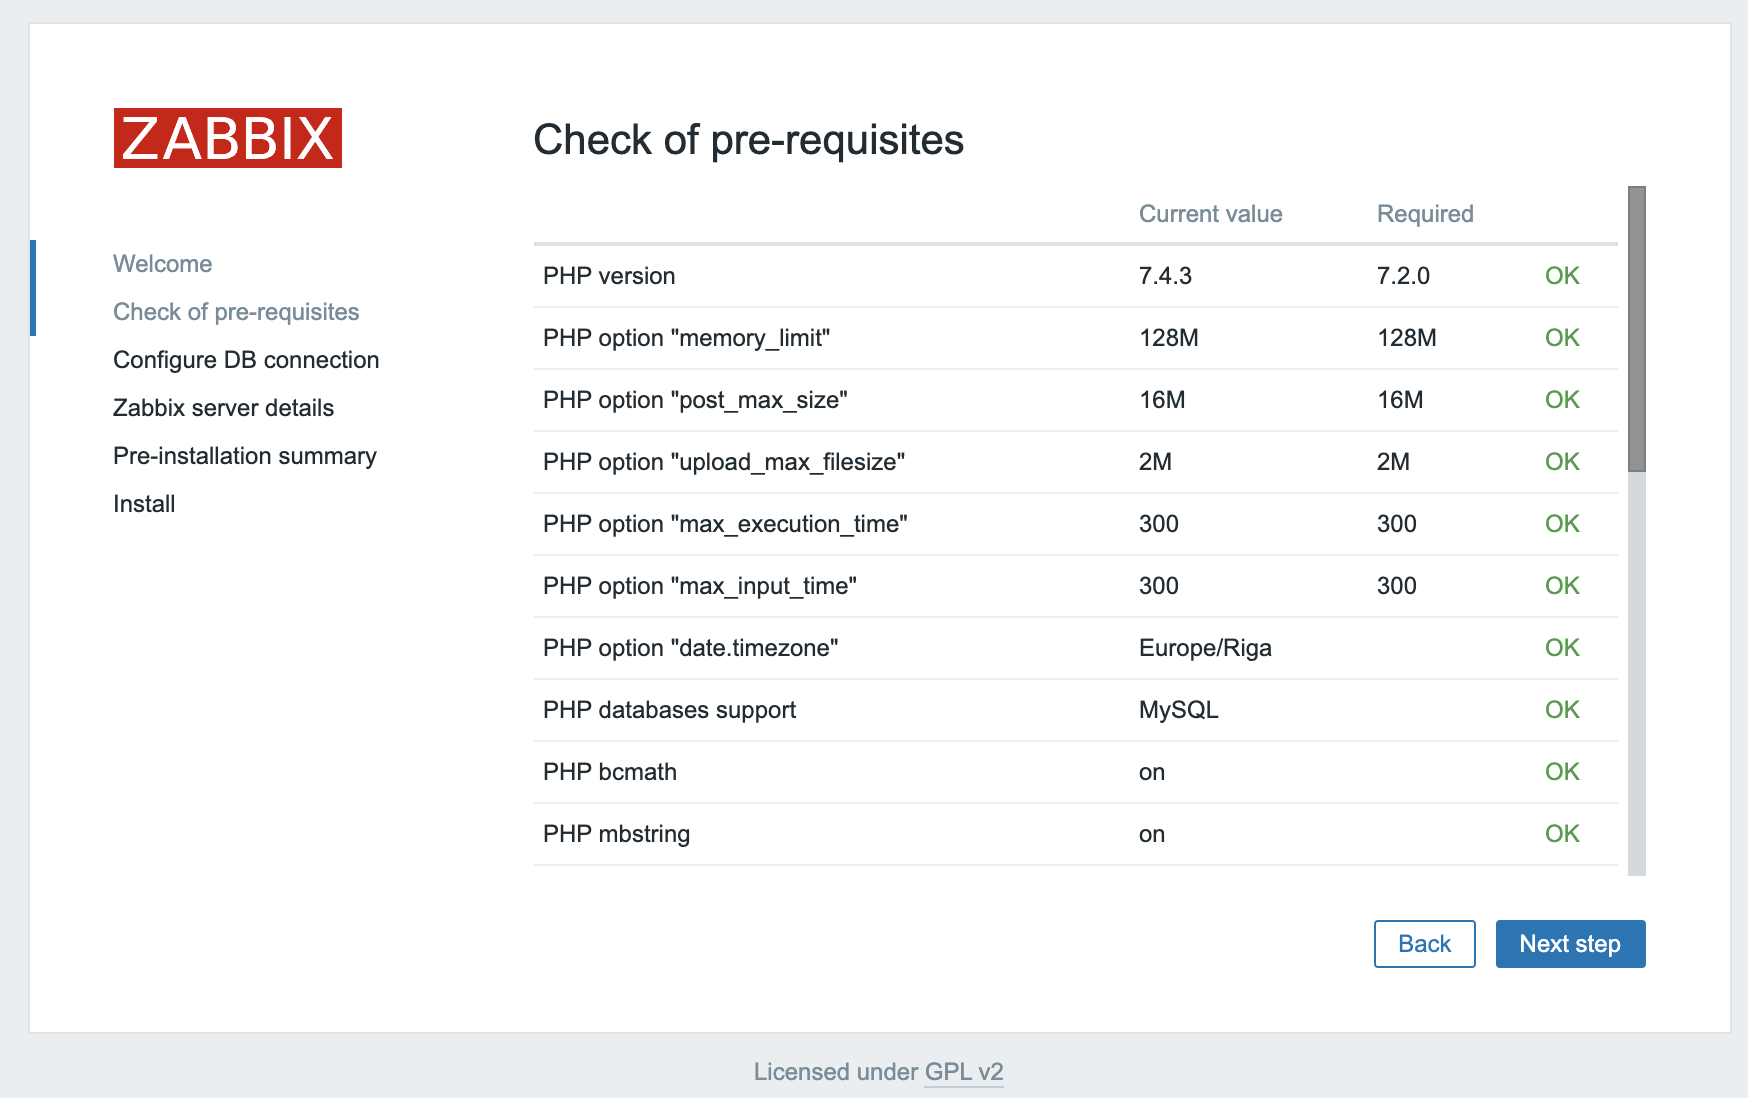
All of the values in this table must be OK, so verify that they are. Be sure to scroll down and look at all of the prerequisites. Once you’ve verified that everything is ready to go, click Next step to proceed.

The next screen asks for database connection information.

DB Connection

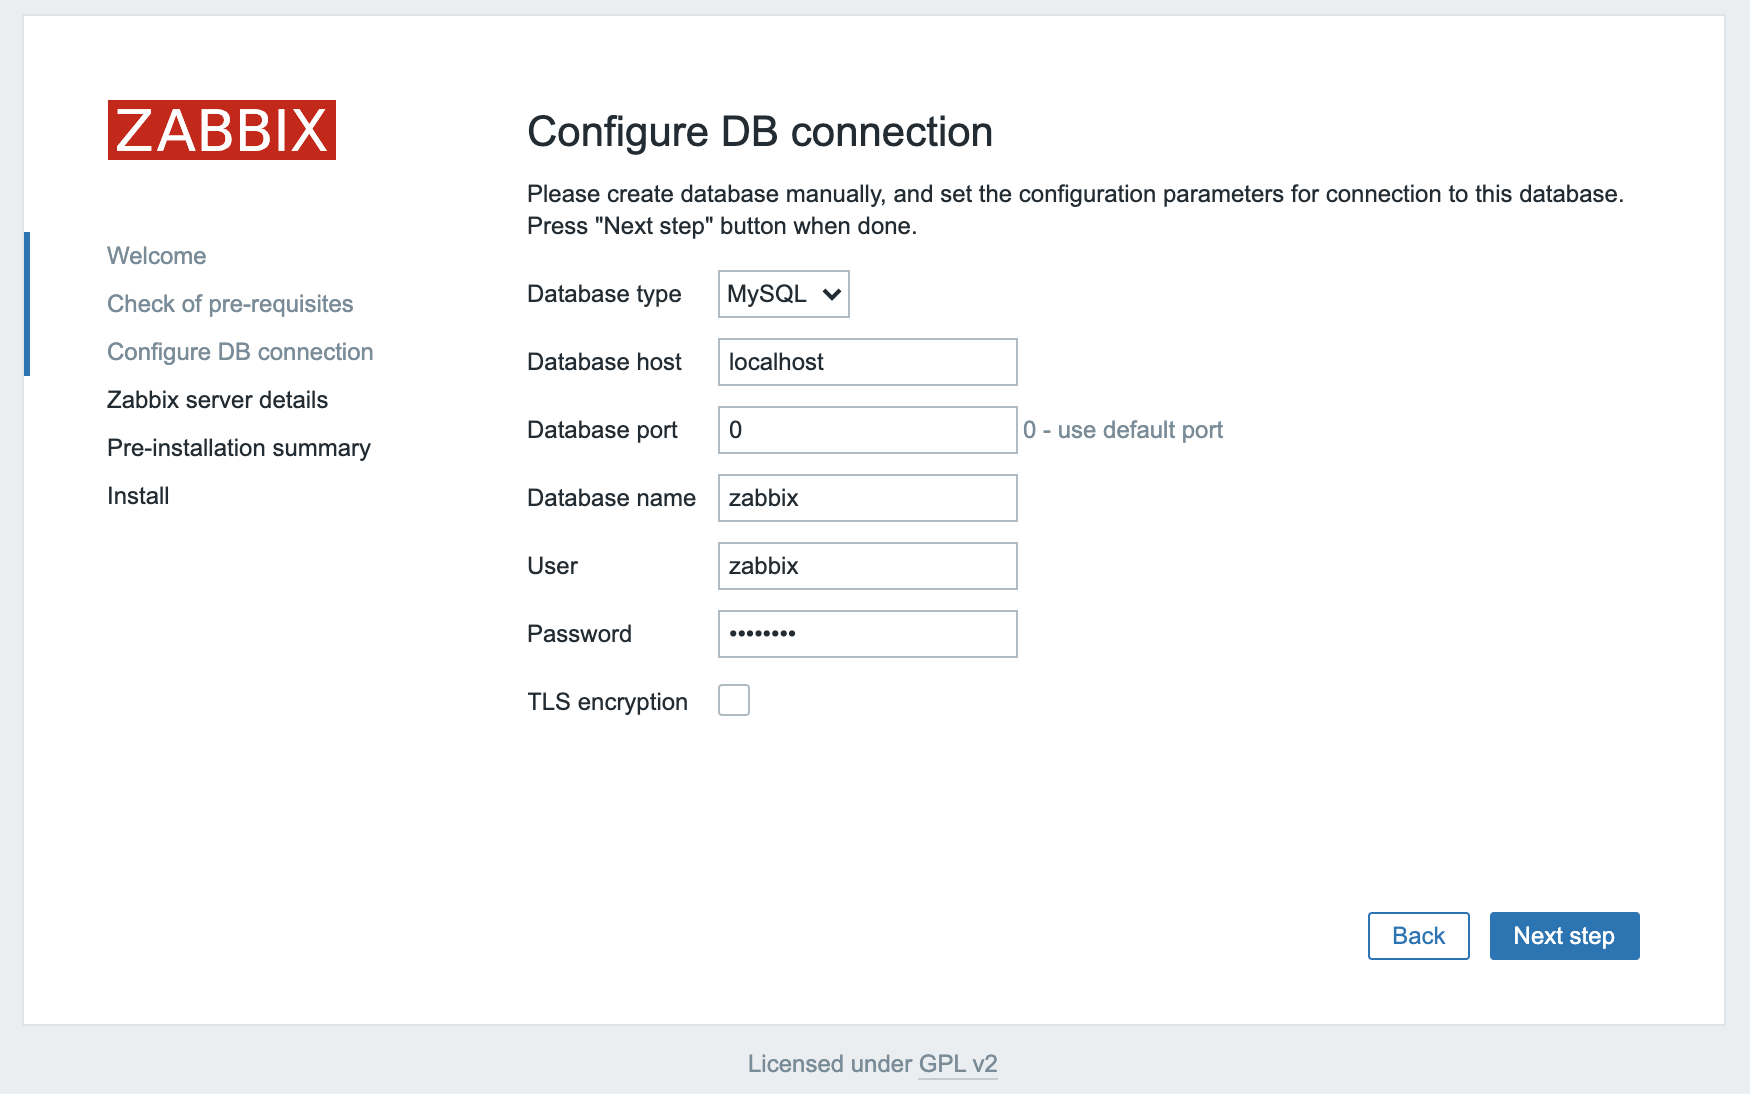
You told the Zabbix server about your database, but the Zabbix web interface also needs access to the database to manage hosts and read data. Therefore enter the MySQL credentials you configured in Step 2. Click Next step to proceed.

On the next screen, you can leave the options at their default values.

Zabbix Server Details

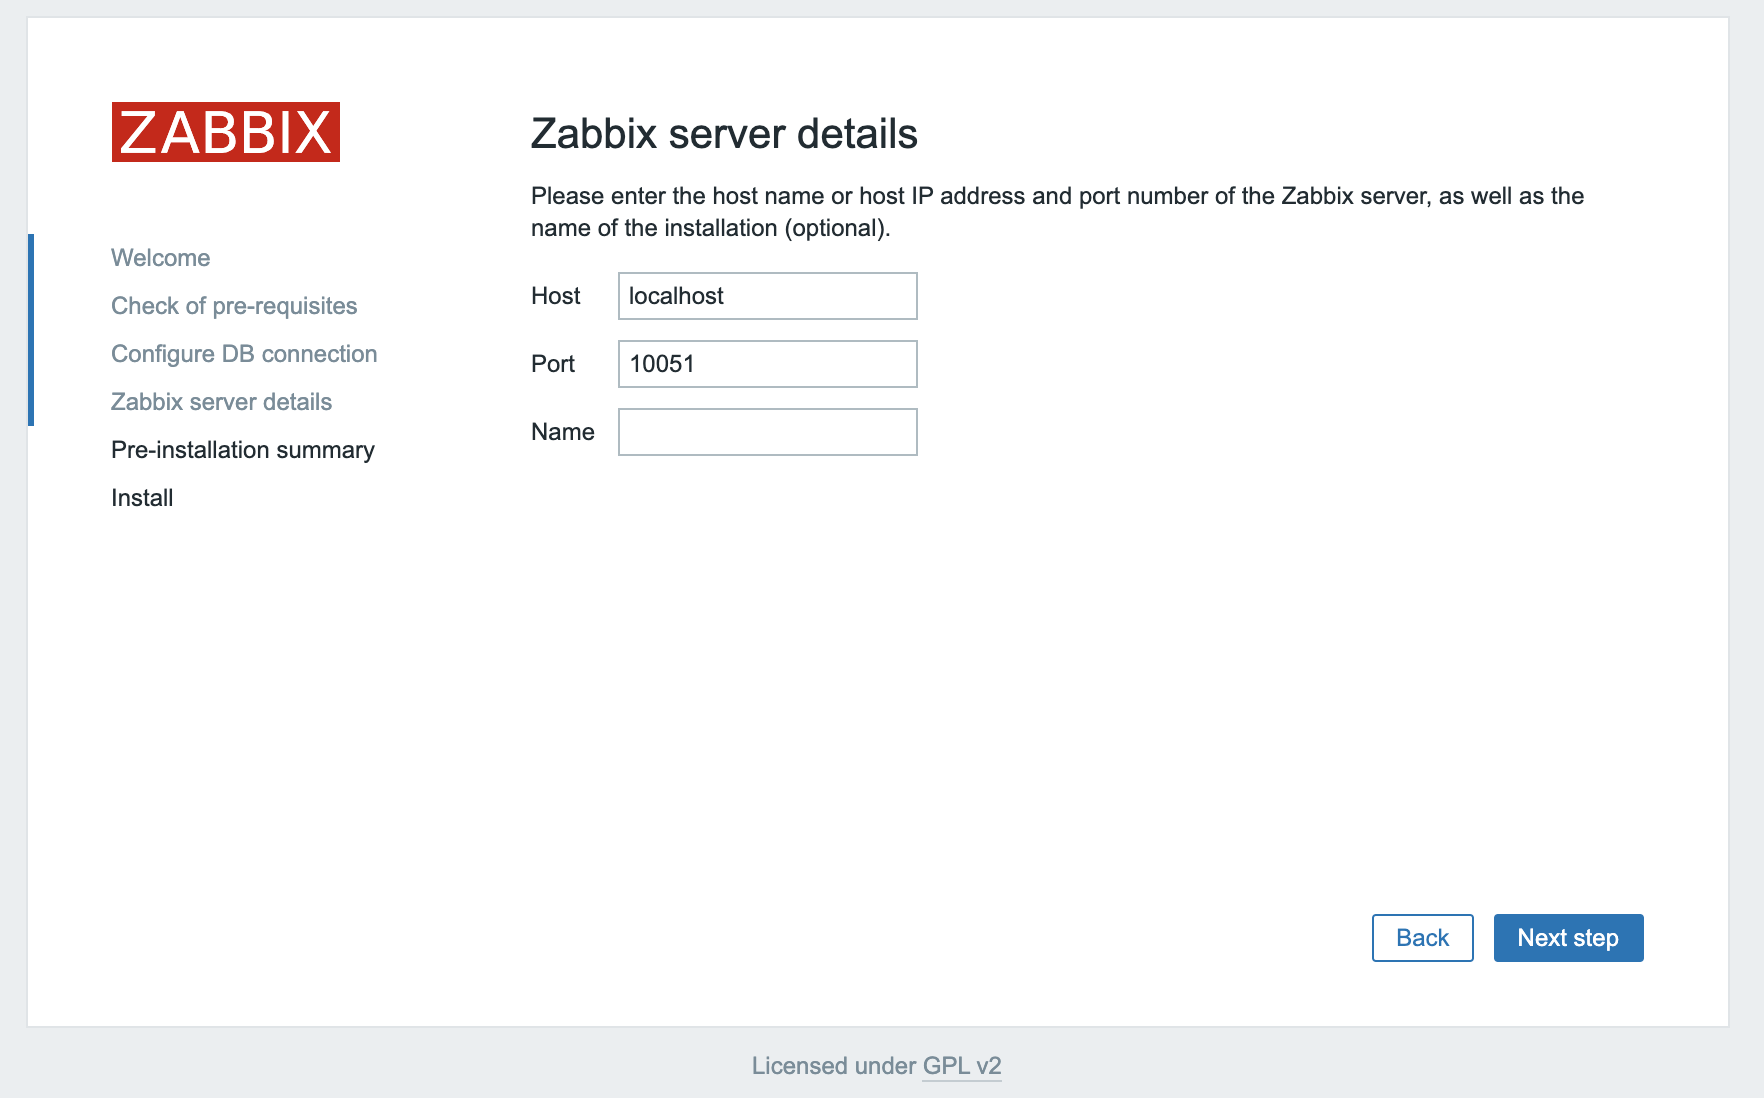
The Name is optional; it is used in the web interface to distinguish one server from another in case you have several monitoring servers. Click Next step to proceed.

The next screen will show the pre-installation summary so you can confirm everything is correct.

Summary

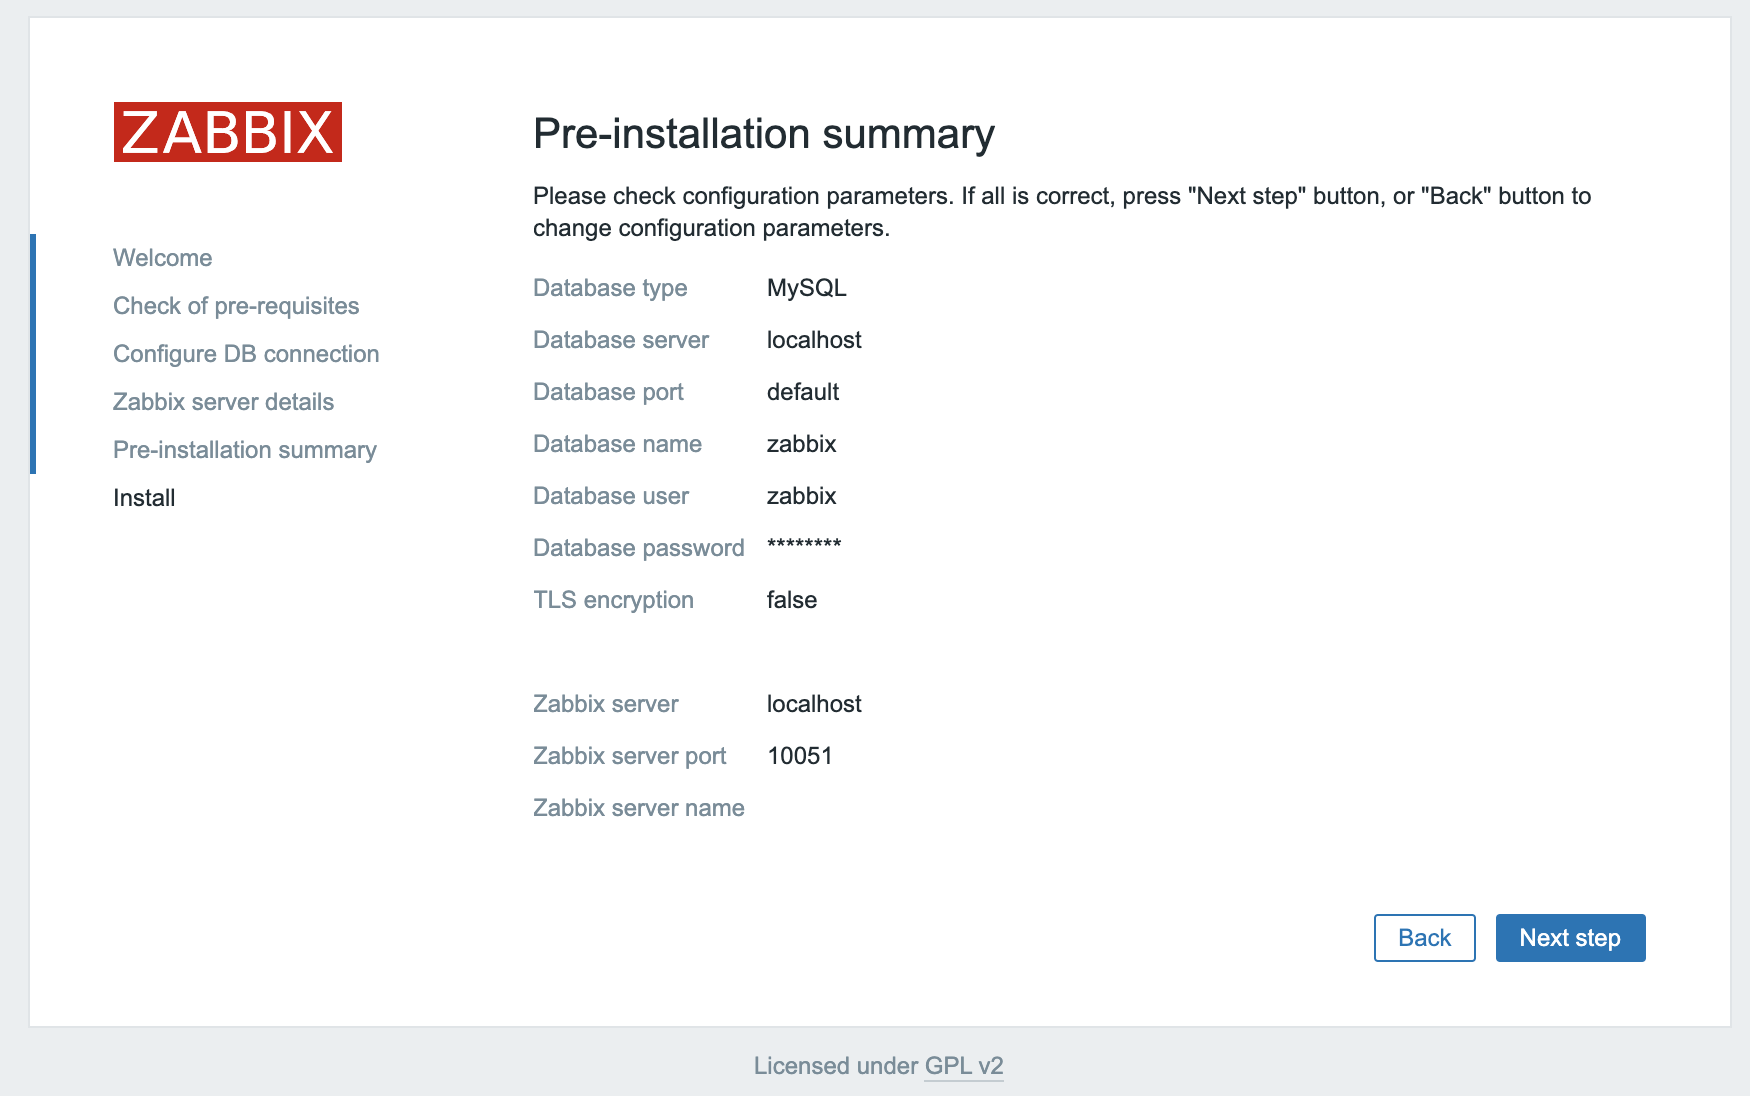
Click Next step to proceed to the final screen.

The web interface setup is now complete. This process creates the configuration file /usr/share/zabbix/conf/zabbix.conf.php, which you could back up and use in the future. Click Finish to proceed to the login screen. The default user is Admin and the password is zabbix.

Before you log in, set up the Zabbix agent on your second Ubuntu server.

Step 6 — Installing and Configuring the Zabbix Agent

Now you need to configure the agent software that will send monitoring data to the Zabbix server.

Log in to the second Ubuntu server:

  • ssh sammy@second_ubuntu_server_ip_address

Just like on the Zabbix server, run the following commands to install the repository configuration package:

  • wget https://repo.zabbix.com/zabbix/5.0/ubuntu/pool/main/z/zabbix-release/zabbix-release_5.0-1+focal_all.deb
  • sudo dpkg -i zabbix-release_5.0-1+focal_all.deb

Next, update the package index:

  • sudo apt update

Then install the Zabbix agent:

  • sudo apt install zabbix-agent

While Zabbix supports certificate-based encryption, setting up a certificate authority is beyond the scope of this tutorial. But you can use pre-shared keys (PSK) to secure the connection between the server and agent.

First, generate a PSK:

  • sudo sh -c “openssl rand -hex 32 > /etc/zabbix/zabbix_agentd.psk”

Show the key by using cat so you can copy it somewhere:

  • cat /etc/zabbix/zabbix_agentd.psk

The key will look something like this:

Output
75ad6cb5e17d244ac8c00c96a1b074d0550b8e7b15d0ab3cde60cd79af280fca

Save this for later; you will need it to configure the host.

Now edit the Zabbix agent settings to set up its secure connection to the Zabbix server. Open the agent configuration file in your text editor:

  • sudo nano /etc/zabbix/zabbix_agentd.conf

Each setting within this file is documented via informative comments throughout the file, but you only need to edit some of them.

First you have to edit the IP address of the Zabbix server. Find the following section:

/etc/zabbix/zabbix_agentd.conf
...
### Option: Server
#       List of comma delimited IP addresses, optionally in CIDR notation, or DNS names of Zabbix servers and Zabbix proxies.
#       Incoming connections will be accepted only from the hosts listed here.
#       If IPv6 support is enabled then '127.0.0.1', '::127.0.0.1', '::ffff:127.0.0.1' are treated equally
#       and '::/0' will allow any IPv4 or IPv6 address.
#       '0.0.0.0/0' can be used to allow any IPv4 address.
#       Example: Server=127.0.0.1,192.168.1.0/24,::1,2001:db8::/32,zabbix.example.com
#
# Mandatory: yes, if StartAgents is not explicitly set to 0
# Default:
# Server=

Server=127.0.0.1
...

Change the default value to the IP of your Zabbix server:

/etc/zabbix/zabbix_agentd.conf
...
Server=zabbix_server_ip_address
...

By default, Zabbix server connects to the agent. But for some checks (for example, monitoring the logs), a reverse connection is required. For correct operation, you need to specify the Zabbix server address and a unique host name.

Find the section that configures the active checks and change the default values:

/etc/zabbix/zabbix_agentd.conf
...
##### Active checks related

### Option: ServerActive
#       List of comma delimited IP:port (or DNS name:port) pairs of Zabbix servers and Zabbix proxies for active checks.
#       If port is not specified, default port is used.
#       IPv6 addresses must be enclosed in square brackets if port for that host is specified.
#       If port is not specified, square brackets for IPv6 addresses are optional.
#       If this parameter is not specified, active checks are disabled.
#       Example: ServerActive=127.0.0.1:20051,zabbix.domain,[::1]:30051,::1,[12fc::1]
#
# Mandatory: no
# Default:
# ServerActive=

ServerActive=zabbix_server_ip_address

### Option: Hostname
#       Unique, case sensitive hostname.
#       Required for active checks and must match hostname as configured on the server.
#       Value is acquired from HostnameItem if undefined.
#
# Mandatory: no
# Default:
# Hostname=

Hostname=Second Ubuntu Server
...

Next, find the section that configures the secure connection to the Zabbix server and enable pre-shared key support. Find the TLSConnect section, which looks like this:

/etc/zabbix/zabbix_agentd.conf
...
### Option: TLSConnect
#       How the agent should connect to server or proxy. Used for active checks.
#       Only one value can be specified:
#               unencrypted - connect without encryption
#               psk         - connect using TLS and a pre-shared key
#               cert        - connect using TLS and a certificate
#
# Mandatory: yes, if TLS certificate or PSK parameters are defined (even for 'unencrypted' connection)
# Default:
# TLSConnect=unencrypted
...

Then add this line to configure pre-shared key support:

/etc/zabbix/zabbix_agentd.conf
...
TLSConnect=psk
...

Next, locate the TLSAccept section, which looks like this:

/etc/zabbix/zabbix_agentd.conf
...
### Option: TLSAccept
#       What incoming connections to accept.
#       Multiple values can be specified, separated by comma:
#               unencrypted - accept connections without encryption
#               psk         - accept connections secured with TLS and a pre-shared key
#               cert        - accept connections secured with TLS and a certificate
#
# Mandatory: yes, if TLS certificate or PSK parameters are defined (even for 'unencrypted' connection)
# Default:
# TLSAccept=unencrypted
...

Configure incoming connections to support pre-shared keys by adding this line:

/etc/zabbix/zabbix_agentd.conf
...
TLSAccept=psk
...

Next, find the TLSPSKIdentity section, which looks like this:

/etc/zabbix/zabbix_agentd.conf
...
### Option: TLSPSKIdentity
#       Unique, case sensitive string used to identify the pre-shared key.
#
# Mandatory: no
# Default:
# TLSPSKIdentity=
...

Choose a unique name to identify your pre-shared key by adding this line:

/etc/zabbix/zabbix_agentd.conf
...
TLSPSKIdentity=PSK 001
...

You’ll use this as the PSK ID when you add your host through the Zabbix web interface.

Then set the option that points to your previously created pre-shared key. Locate the TLSPSKFileoption:

/etc/zabbix/zabbix_agentd.conf
...
### Option: TLSPSKFile
#       Full pathname of a file containing the pre-shared key.
#
# Mandatory: no
# Default:
# TLSPSKFile=
...

Add this line to point the Zabbix agent to your PSK file you created:

/etc/zabbix/zabbix_agentd.conf
...
TLSPSKFile=/etc/zabbix/zabbix_agentd.psk
...

Save and close the file. Now you can restart the Zabbix agent and set it to start at boot time:

  • sudo systemctl restart zabbix-agent
  • sudo systemctl enable zabbix-agent

For good measure, check that the Zabbix agent is running properly:

  • sudo systemctl status zabbix-agent

You will see the following status, indicating the agent is running:

Output
● zabbix-agent.service - Zabbix Agent
   Loaded: loaded (/lib/systemd/system/zabbix-agent.service; enabled; vendor preset: enabled)
   Active: active (running) since Fri 2020-06-12 08:19:54 UTC; 25s ago
  ...

The agent will listen on port 10050 for connections from the server. Configure UFW to allow connections to this port:

  • sudo ufw allow 10050/tcp

You can learn more about UFW in How To Set Up a Firewall with UFW on Ubuntu 20.04.

Your agent is now ready to send data to the Zabbix server. But in order to use it, you have to link to it from the server’s web console. In the next step, you will complete the configuration.

Step 7 — Adding the New Host to the Zabbix Server

Installing an agent on a server you want to monitor is only half of the process. Each host you want to monitor needs to be registered on the Zabbix server, which you can do through the web interface.

Log in to the Zabbix Server web interface by navigating to the address http://zabbix_server_name or https://zabbix_server_name:

The Zabbix login screen

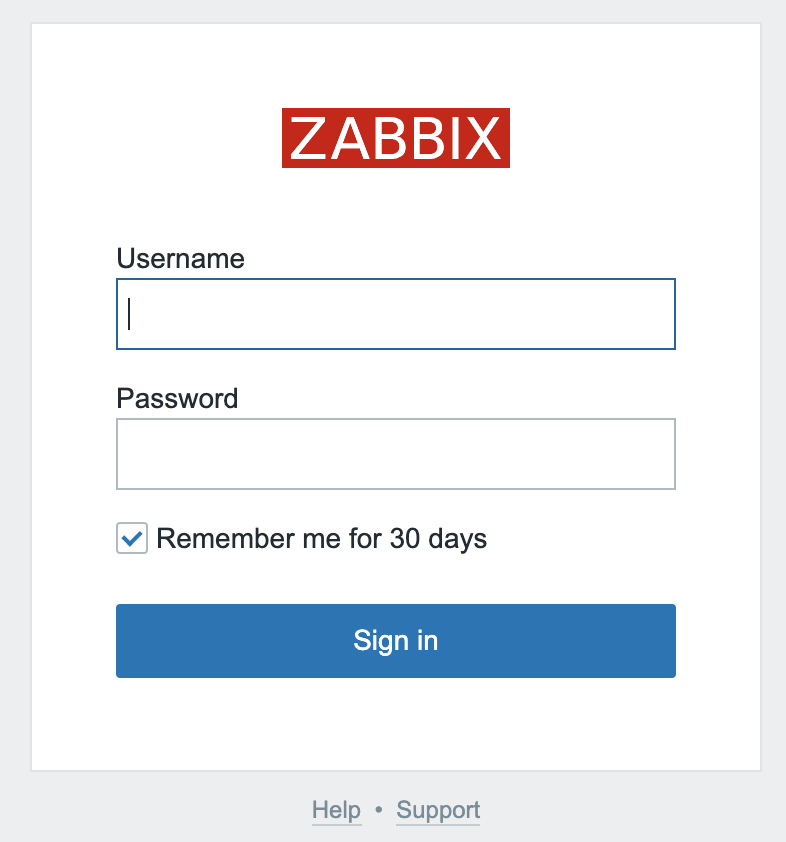
When you have logged in, click on Configuration and then Hosts in the left navigation bar. Then click the Create host button in the top right corner of the screen. This will open the host configuration page.

Creating a host

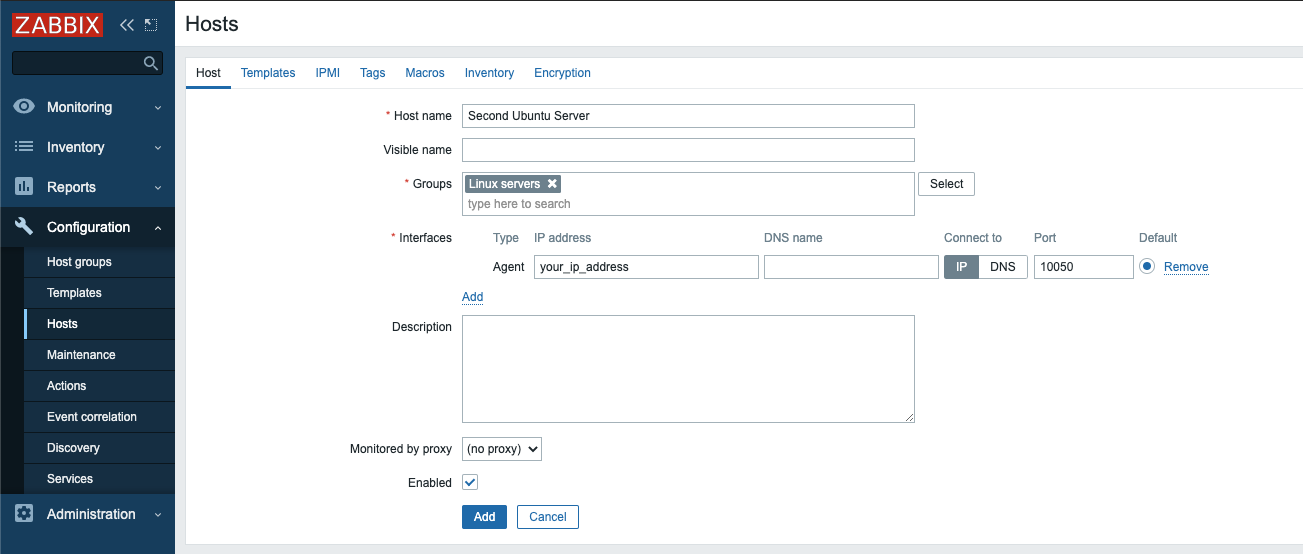
Adjust the Host name and IP address to reflect the host name and IP address of your second Ubuntu server, then add the host to a group. You can select an existing group, for example Linux servers, or create your own group. The host can be in multiple groups. To do this, enter the name of an existing or new group in the Groups field and select the desired value from the proposed list.

Before adding the group, click the Templates tab.

Adding a template to the host

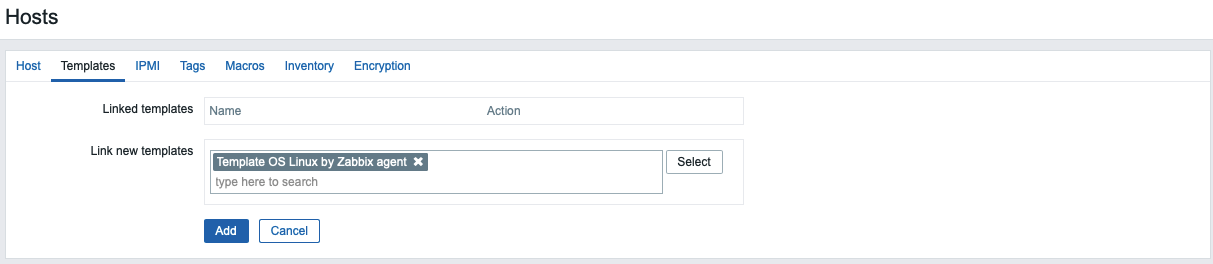
Type Template OS Linux by Zabbix agent in the Search field and then select it from the list to add this template to the host.

Next, navigate to the Encryption tab. Select PSK for both Connections to host and Connections from host. Then set PSK identity to PSK 001, which is the value of the TLSPSKIdentity setting of the Zabbix agent you configured previously. Then set PSK value to the key you generated for the Zabbix agent. It’s the one stored in the file /etc/zabbix/zabbix_agentd.psk on the agent machine.

Setting up the encryption

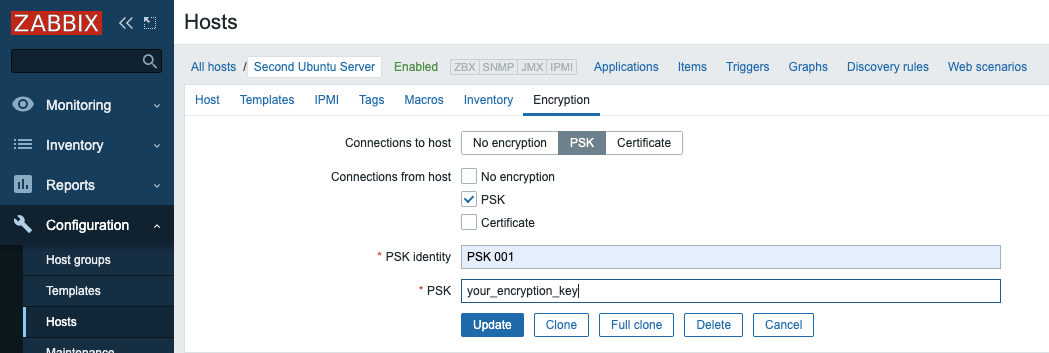
Finally, click the Add button at the bottom of the form to create the host.

You will see your new host in the list. Wait for a minute and reload the page to see green labels indicating that everything is working fine and the connection is encrypted.

Zabbix shows your new host

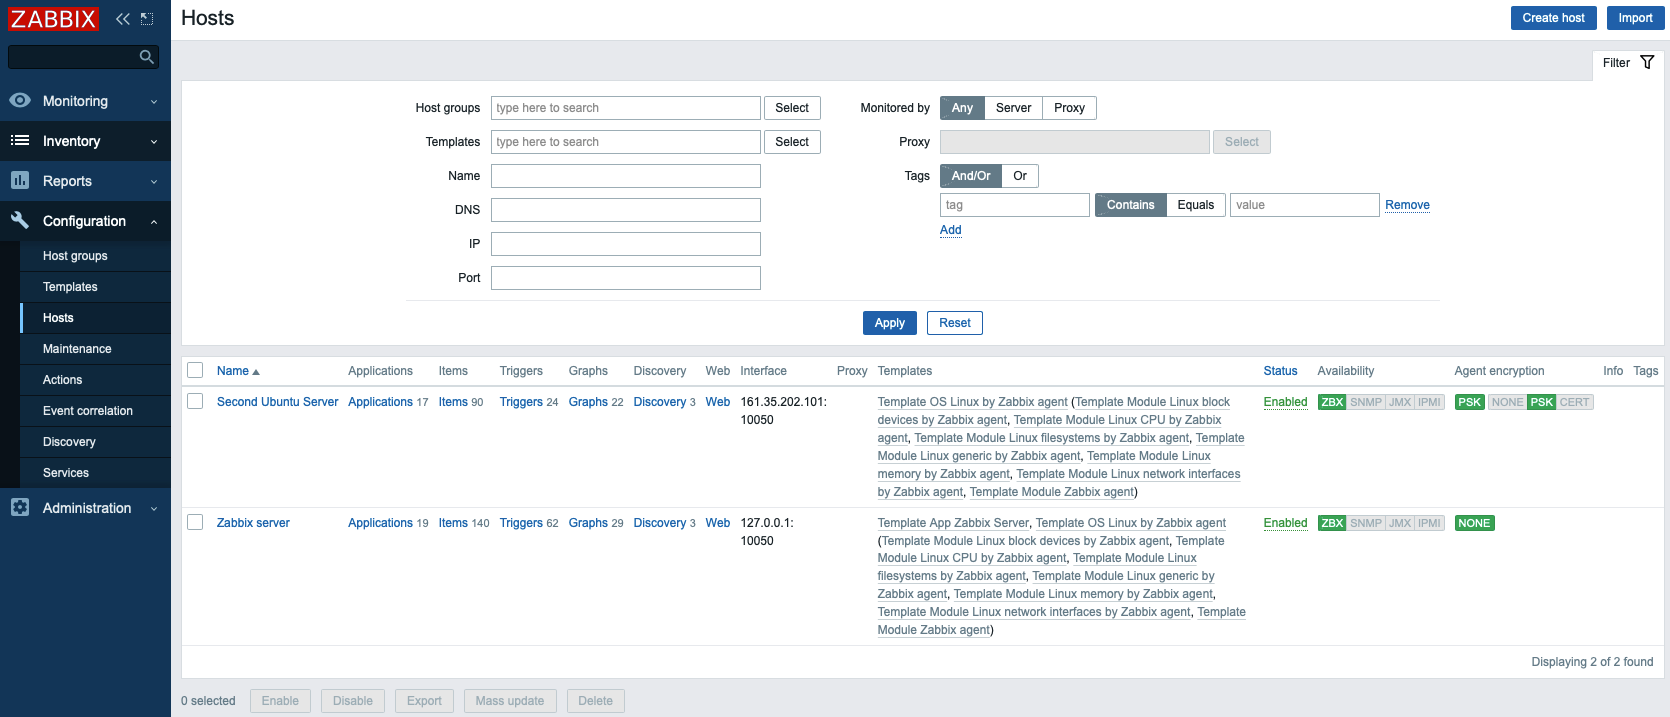
If you have additional servers you need to monitor, log in to each host, install the Zabbix agent, generate a PSK, configure the agent, and add the host to the web interface following the same steps you followed to add your first host.

The Zabbix server is now monitoring your second Ubuntu server. Now, set up email notifications to be notified about problems.

Step 8 — Configuring Email Notifications

Zabbix automatically supports many types of notifications: email, OTRSSlackTelegram, SMS, etc. You can see the full list of integrations at the Zabbix website.

As an example, this tutorial will configure notifications for the Email media type.

Click on Administration, and then Media types in the left navigation bar. You will see the list of all media types. There are two preconfigured options for emails: for the plain text notification and for the HTML notifications. In this tutorial you will use plain text notification. Click on Email.

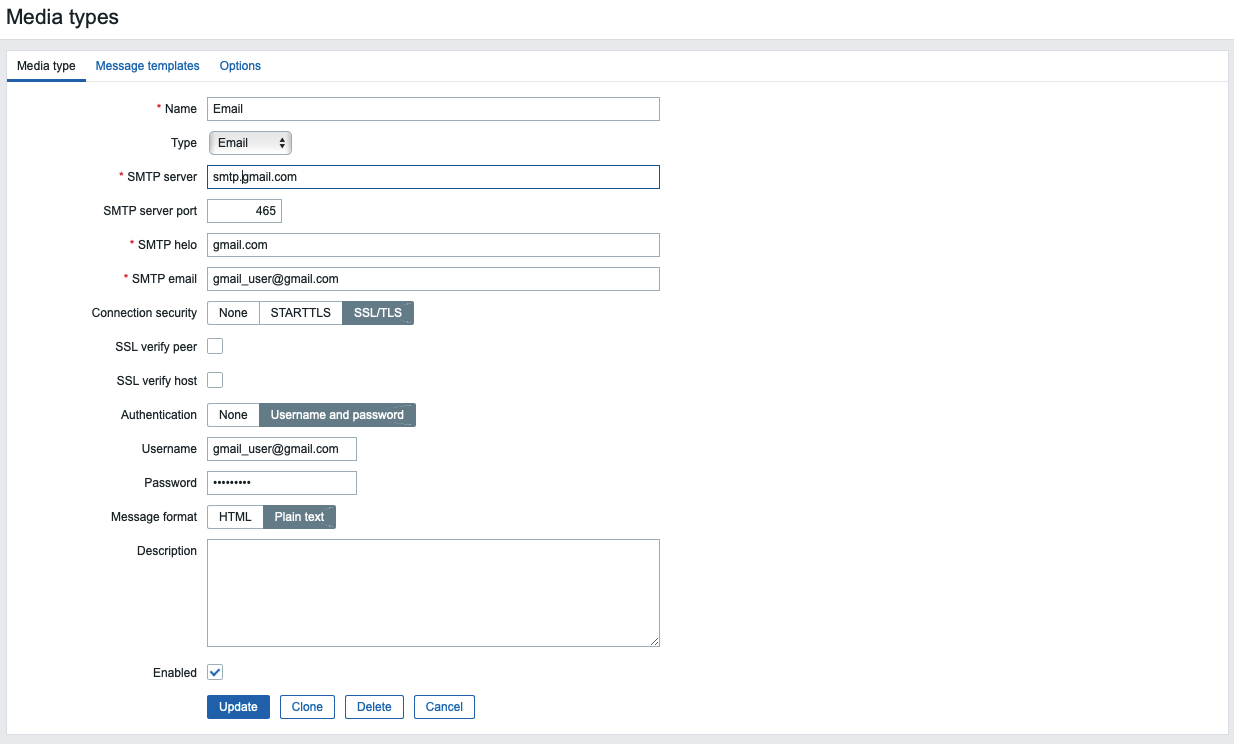
Adjust the SMTP options according to the settings provided by your email service. This tutorial uses Gmail’s SMTP capabilities to set up email notifications; if you would like more information about setting this up, see How To Use Google’s SMTP Server.


Note: If you use 2-Step Verification with Gmail, you need to generate an App Password for Zabbix. You’ll only have to enter an App password once during setup. You will find instructions on how to generate this password in the Google Help Center.

If you are using Gmail, type in smtp.gmail.com for the SMTP server field, 465 for the SMTP server port field, gmail.com for SMTP helo, and your email for SMTP email. Then choose SSL/TLS for Connection security and Username and password for Authentication. Enter your Gmail address as the Username, and the App Password you generated from your Google account as the Password.

Setting up email media type

On the Message templates tab you can see the list of predefined messages for various types of notifications. Finally, click the Update button at the bottom of the form to update the email parameters.

Now you can test sending notifications. To do this, click the Test underlined link in the corresponding line.

You will see a pop-up window. Enter your email address in the Send to field and click the Testbutton. You will see a message about the successful sending and you will receive a test message.

Testing email

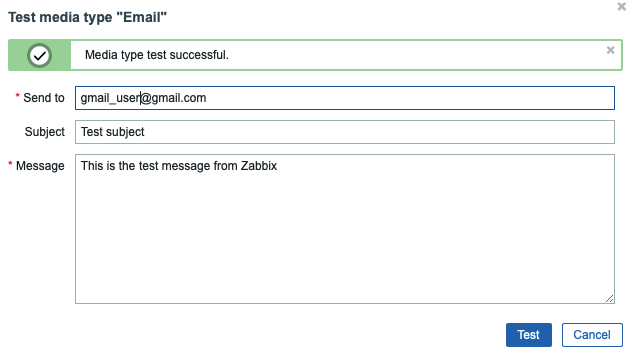
Close the pop-up by clicking the Cancel button.

Now, create a new user. Click on Administration, and then Users in the left navigation bar. You will see the list of users. Then click the Create user button in the top right corner of the screen. This will open the user configuration page:

Creating a user

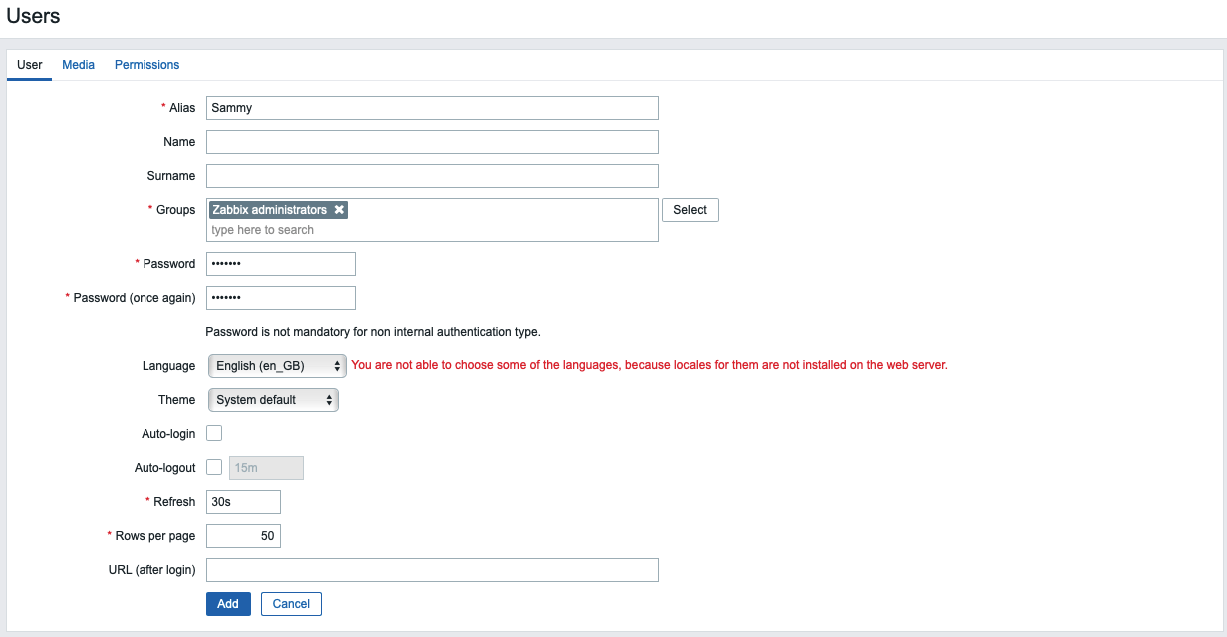
Enter the new username in the Alias field and set up a new password. Next, add the user to the administrator’s group. Type Zabbix administrators in the Groups field and select it from the proposed list.

Once you’ve added the group, click the Media tab and click on the Add underlined link (not the Add button below it). You will see a pop-up window.

Adding an email

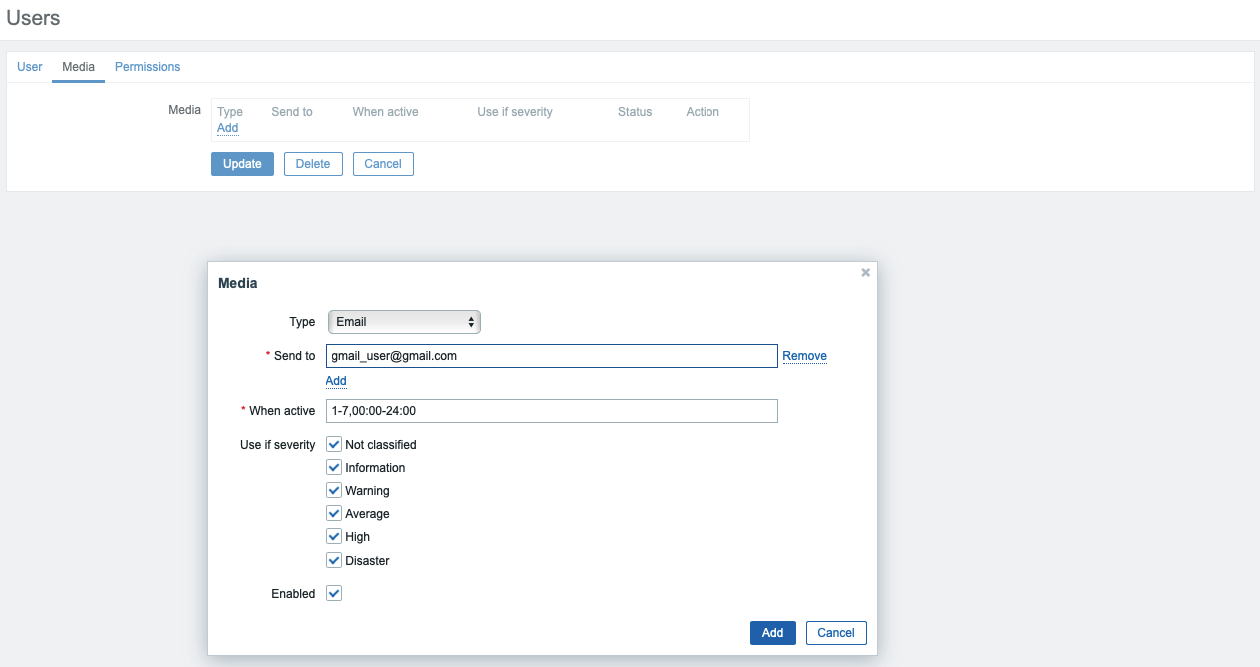
Select the Email option from the Type drop down. Enter your email address in the Send to field. You can leave the rest of the options at the default values. Click the Add button at the bottom to submit.

Now navigate to the Permissions tab. Select Zabbix Super Admin from the User type drop-down menu.

Finally, click the Add button at the bottom of the form to create the user.

Note: Using the default password is not safe. In order to change the password of the built-in user Admin click on the alias in the list of users. Then click Change password, enter a new password, and confirm the changes by clicking Update button.

Now you need to enable notifications. Click on the Configuration tab and then Actions in the left navigation bar. You will see a pre-configured action, which is responsible for sending notifications to all Zabbix administrators. You can review and change the settings by clicking on its name. For the purposes of this tutorial, use the default parameters. To enable the action, click on the red Disabled link in the Status column.

Now you are ready to receive alerts. In the next step, you will generate one to test your notification setup.

Step 9 — Generating a Test Alert

In this step, you will generate a test alert to ensure everything is connected. By default, Zabbix keeps track of the amount of free disk space on your server. It automatically detects all disk mounts and adds the corresponding checks. This discovery is executed every hour, so you need to wait a while for the notification to be triggered.

Create a temporary file that’s large enough to trigger Zabbix’s file system usage alert. To do this, log in to your second Ubuntu server if you’re not already connected:

  • ssh sammy@second_ubuntu_server_ip_address

Next, determine how much free space you have on the server. You can use the df command to find out:

  • df -h

The command df will report the disk space usage of your file system, and the -h will make the output human-readable. You’ll see output like the following:

Output
Filesystem      Size  Used Avail Use% Mounted on
/dev/vda1        78G  1.4G   77G    2% /

In this case, the free space is 77G. Your free space may differ.

Use the fallocate command, which allows you to pre-allocate or de-allocate space to a file, to create a file that takes up more than 80% of the available disk space. This will be enough to trigger the alert:

  • fallocate -l 70G /tmp/temp.img

After around an hour, Zabbix will trigger an alert about the amount of free disk space and will run the action you configured, sending the notification message. You can check your inbox for the message from the Zabbix server. You will see a message like:

Problem started at 09:49:08 on 2020.06.12
Problem name: /: Disk space is low (used > 80%)
Host: Second Ubuntu Server
Severity: Warning
Operational data: Space used: 71.34 GB of 77.36 GB (92.23 %)
Original problem ID: 106

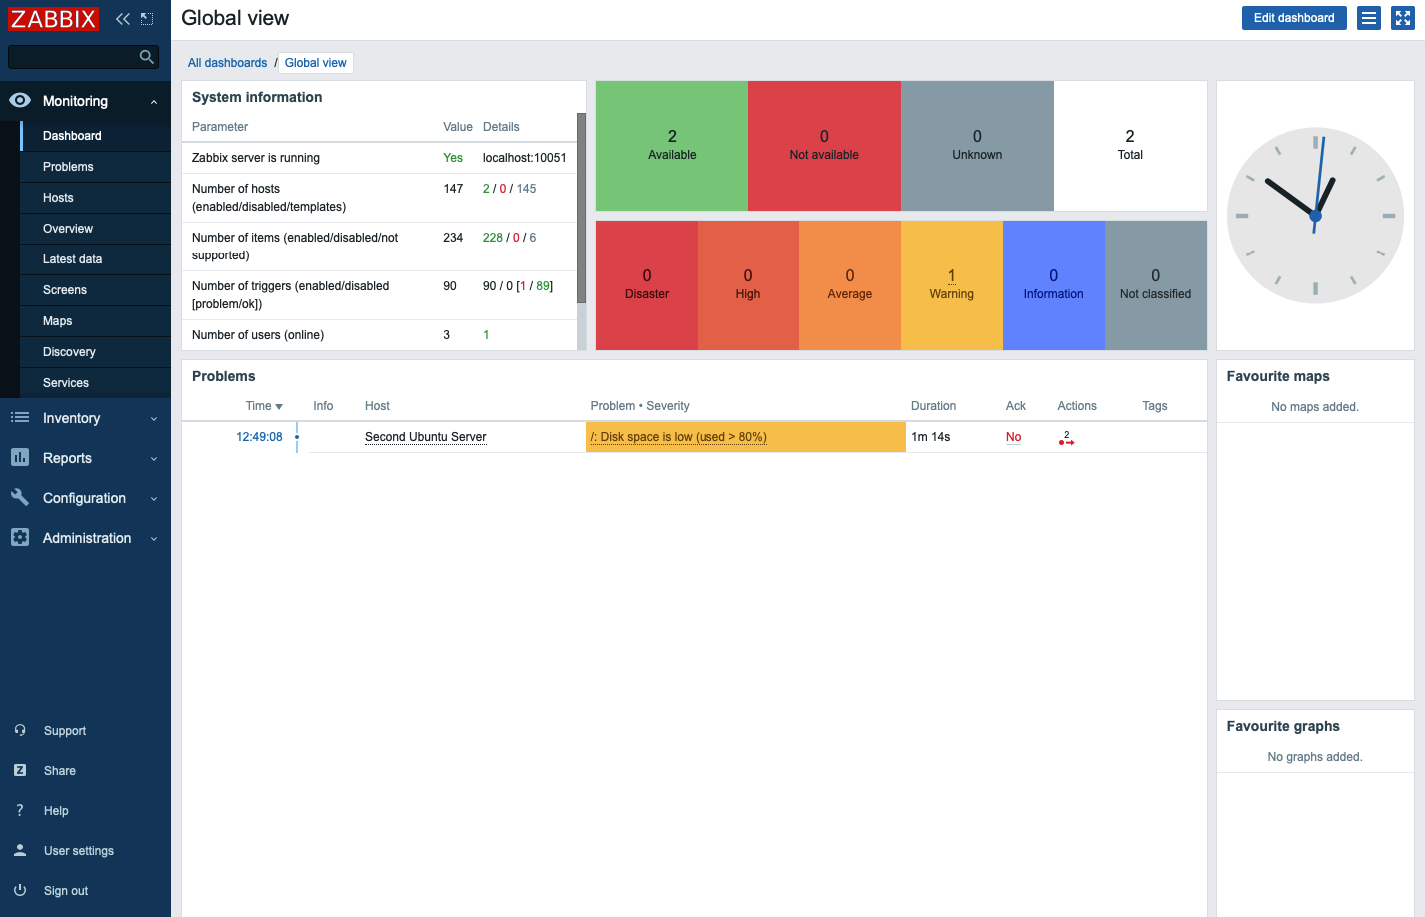
You can also navigate to the Monitoring tab and then Dashboard to see the notification and its details.

Main dashboard

Now that you know the alerts are working, delete the temporary file you created so you can reclaim your disk space:

  • rm -f /tmp/temp.img

After a minute Zabbix will send the recovery message and the alert will disappear from the main dashboard.

Conclusion

In this tutorial, you learned how to set up a simple and secure monitoring solution that will help you monitor the state of your servers. It can now warn you of problems, and you have the opportunity to analyze the processes occurring in your IT infrastructure.

To learn more about setting up monitoring infrastructure, check out our Monitoring topic page.

How To Install Jenkins on Ubuntu 20.04

Introduction
When faced with repetitive technical tasks, finding automation solutions that work can be a chore. With Jenkins, an open-source automation server, you can efficiently manage tasks from building to deploying software. Jenkins is Java-based, installed from Ubuntu packages or by downloading and running its web application archive (WAR) file — a collection of files that make up a complete web application to run on a server.

In this tutorial we’ll install Jenkins on Ubuntu 20.04, start the development server and create an administrative user to get you started in exploring what Jenkins can do. While you’ll have a development-level server ready for use at the conclusion of this tutorial, to secure this installation for production, follow the guide How to Configure Jenkins with SSL Using an Nginx Reverse Proxy on Ubuntu 18.04.

Prerequisites
To follow this tutorial, you will need:

One Ubuntu 20.04 server configured with a non-root sudo user and firewall by following the Ubuntu 20.04 initial server setup guide. We recommend starting with at least 1 GB of RAM. Visit Jenkins’s “Hardware Recommendations” for guidance in planning the capacity of a production-level Jenkins installation.
Oracle JDK 11 installed, following our guidelines on installing specific versions of OpenJDK on Ubuntu 20.04.

Step 1 — Installing Jenkins
The version of Jenkins included with the default Ubuntu packages is often behind the latest available version from the project itself. To ensure you have the latest fixes and features, use the project-maintained packages to install Jenkins.

First, add the repository key to the system:

$ wget -q -O - https://pkg.jenkins.io/debian-stable/jenkins.io.key | sudo apt-key add -

After the key is added the system will return with OK.

Next, let’s append the Debian package repository address to the server’s sources.list:

$ sudo sh -c 'echo deb http://pkg.jenkins.io/debian-stable binary/ > /etc/apt/sources.list.d/jenkins.list'
After both commands have been entered, we’ll run update so that apt will use the new repository.
$ sudo apt update

Finally, we’ll install Jenkins and its dependencies.

$ sudo apt install jenkins

Now that Jenkins and its dependencies are in place, we’ll start the Jenkins server.

Step 2 — Starting Jenkins
Let’s start Jenkins by using systemctl:

$ sudo systemctl start jenkins

Since systemctl doesn’t display status output, we’ll use the status command to verify that Jenkins started successfully:

$ sudo systemctl status jenkins

If everything went well, the beginning of the status output shows that the service is active and configured to start at boot:

Output
● jenkins.service - LSB: Start Jenkins at boot time
   Loaded: loaded (/etc/init.d/jenkins; generated)
   Active: active (exited) since Fri 2020-06-05 21:21:46 UTC; 45s ago
     Docs: man:systemd-sysv-generator(8)
    Tasks: 0 (limit: 1137)
   CGroup: /system.slice/jenkins.service
Now that Jenkins is up and running, let’s adjust our firewall rules so that we can reach it from a web browser to complete the initial setup.

Step 3 — Opening the Firewall
To set up a UFW firewall, visit Initial Server Setup with Ubuntu 20.04, Step 4- Setting up a Basic Firewall. By default, Jenkins runs on port 8080. We’ll open that port using ufw:

$ sudo ufw allow 8080

Note: If the firewall is inactive, the following commands will allow OpenSSH and enable the firewall:

$ sudo ufw allow OpenSSH
$ sudo ufw enable

Check ufw’s status to confirm the new rules:

$ sudo ufw status

You’ll notice that traffic is allowed to port 8080 from anywhere:

Output
Status: active

To                         Action      From
--                         ------      ----
OpenSSH                    ALLOW       Anywhere
8080                       ALLOW       Anywhere
OpenSSH (v6)               ALLOW       Anywhere (v6)
8080 (v6)                  ALLOW       Anywhere (v6)

With Jenkins installed and our firewall configured, we can complete the installation stage and dive into Jenkins setup.

Step 4 — Setting Up Jenkins
To set up your installation, visit Jenkins on its default port, 8080, using your server domain name or IP address: http://your_server_ip_or_domain:8080

You should receive the Unlock Jenkins screen, which displays the location of the initial password:

Unlock Jenkins screen

In the terminal window, use the cat command to display the password:

$ sudo cat /var/lib/jenkins/secrets/initialAdminPassword

Copy the 32-character alphanumeric password from the terminal and paste it into the Administrator password field, then click Continue.

The next screen presents the option of installing suggested plugins or selecting specific plugins:

Customize Jenkins Screen

We’ll click the Install suggested plugins option, which will immediately begin the installation process.

Jenkins Getting Started Install Plugins Screen

When the installation is complete, you’ll be prompted to set up the first administrative user. It’s possible to skip this step and continue as admin using the initial password we used above, but we’ll take a moment to create the user.

Note: The default Jenkins server is NOT encrypted, so the data submitted with this form is not protected. Refer to How to Configure Jenkins with SSL Using an Nginx Reverse Proxy on Ubuntu 20.04 to protect user credentials and information about builds that are transmitted via the web interface.

Jenkins Create First Admin User Screen

Enter the name and password for your user:

Jenkins Create User

You’ll receive an Instance Configuration page that will ask you to confirm the preferred URL for your Jenkins instance. Confirm either the domain name for your server or your server’s IP address:

Jenkins Instance Configuration

After confirming the appropriate information, click Save and Finish. You’ll receive a confirmation page confirming that “Jenkins is Ready!”:

Jenkins is ready screen

Click Start using Jenkins to visit the main Jenkins dashboard:

Welcome to Jenkins Screen

At this point, you have completed a successful installation of Jenkins.

Conclusion
In this tutorial, you installed Jenkins using the project-provided packages, started the server, opened the firewall, and created an administrative user. At this point, you can start exploring Jenkins.

When you’ve completed your exploration, follow the guide How to Configure Jenkins with SSL Using an Nginx Reverse Proxy on Ubuntu 20.04 to protect your passwords, as well as any sensitive system or product information that will be sent between your machine and the server in plain text to continue using Jenkins.

To learn more about what you can do using Jenkins, check out other tutorials on the subject:

How to Build Android Apps with Jenkins
How To Set Up Continuous Integration Pipelines in Jenkins on Ubuntu 16.04

How To Create a Self-Signed SSL Certificate for Apache in Ubuntu 20.04

Introduction
TLS, or “transport layer security” — and its predecessor SSL — are protocols used to wrap normal traffic in a protected, encrypted wrapper. Using this technology, servers can safely send information to their clients without their messages being intercepted or read by an outside party.

In this guide, we will show you how to create and use a self-signed SSL certificate with the Apache web server on Ubuntu 20.04.

Note: A self-signed certificate will encrypt communication between your server and any clients. However, because it is not signed by any of the trusted certificate authorities included with web browsers and operating systems, users cannot use the certificate to validate the identity of your server automatically. As a result, your users will see a security error when visiting your site.

Because of this limitation, self-signed certificates are not appropriate for a production environment serving the public. They are typically used for testing, or for securing non-critical services used by a single user or a small group of users that can establish trust in the certificate’s validity through alternate communication channels.

For a more production-ready certificate solution, check out Let’s Encrypt, a free certificate authority. You can learn how to download and configure a Let’s Encrypt certificate in our How To Secure Apache with Let’s Encrypt on Ubuntu 20.04 tutorial.

Prerequisites
Before starting this tutorial, you’ll need the following:

Access to a Ubuntu 20.04 server with a non-root, sudo-enabled user. Our Initial Server Setup with Ubuntu 20.04 guide can show you how to create this account.
You will also need to have Apache installed. You can install Apache using apt. First, update the local package index to reflect the latest upstream changes:

 $ sudo apt update

Then, install the apache2 package:

 $ sudo apt install apache2

And finally, if you have a ufw firewall set up, open up the http and https ports:

 $ sudo ufw allow "Apache Full"

After these steps are complete, be sure you are logged in as your non-root user and continue with the tutorial.

Step 1 — Enabling mod_ssl
Before we can use any SSL certificates, we first have to enable mod_ssl, an Apache module that provides support for SSL encryption.

Enable mod_ssl with the a2enmod command:

$ sudo a2enmod ssl
Restart Apache to activate the module:

$ sudo systemctl restart apache2
The mod_ssl module is now enabled and ready for use.

Step 2 – Creating the SSL Certificate
Now that Apache is ready to use encryption, we can move on to generating a new SSL certificate. The certificate will store some basic information about your site, and will be accompanied by a key file that allows the server to securely handle encrypted data.

We can create the SSL key and certificate files with the openssl command:

 $ sudo openssl req -x509 -nodes -days 365 -newkey rsa:2048 -keyout /etc/ssl/private/apache-selfsigned.key -out /etc/ssl/certs/apache-selfsigned.crt

After you enter the command, you will be taken to a prompt where you can enter information about your website. Before we go over that, let’s take a look at what is happening in the command we are issuing:

openssl: This is the command line tool for creating and managing OpenSSL certificates, keys, and other files.
req -x509: This specifies that we want to use X.509 certificate signing request (CSR) management. X.509 is a public key infrastructure standard that SSL and TLS adhere to for key and certificate management.
-nodes: This tells OpenSSL to skip the option to secure our certificate with a passphrase. We need Apache to be able to read the file, without user intervention, when the server starts up. A passphrase would prevent this from happening, since we would have to enter it after every restart.
-days 365: This option sets the length of time that the certificate will be considered valid. We set it for one year here. Many modern browsers will reject any certificates that are valid for longer than one year.
-newkey rsa:2048: This specifies that we want to generate a new certificate and a new key at the same time. We did not create the key that is required to sign the certificate in a previous step, so we need to create it along with the certificate. The rsa:2048 portion tells it to make an RSA key that is 2048 bits long.
-keyout: This line tells OpenSSL where to place the generated private key file that we are creating.
-out: This tells OpenSSL where to place the certificate that we are creating.
Fill out the prompts appropriately. The most important line is the one that requests the Common Name. You need to enter either the hostname you’ll use to access the server by, or the public IP of the server. It’s important that this field matches whatever you’ll put into your browser’s address bar to access the site, as a mismatch will cause more security errors.

The full list of prompts will look something like this:

Country Name (2 letter code) [XX]:US
State or Province Name (full name) []:Example
Locality Name (eg, city) [Default City]:Example 
Organization Name (eg, company) [Default Company Ltd]:Example Inc
Organizational Unit Name (eg, section) []:Example Dept
Common Name (eg, your name or your server's hostname) []:your_domain_or_ip
Email Address []:[email protected]
Both of the files you created will be placed in the appropriate subdirectories under /etc/ssl.

Next we will update our Apache configuration to use the new certificate and key.

Step 3 – Configuring Apache to Use SSL
Now that we have our self-signed certificate and key available, we need to update our Apache configuration to use them. On Ubuntu, you can place new Apache configuration files (they must end in .conf) into /etc/apache2/sites-available/and they will be loaded the next time the Apache process is reloaded or restarted.

For this tutorial we will create a new minimal configuration file. (If you already have an Apache set up and just need to add SSL to it, you will likely need to copy over the configuration lines that start with SSL, and switch the VirtualHost port from 80 to 443. We will take care of port 80 in the next step.)

Open a new file in the /etc/apache2/sites-available directory:

 $ sudo nano /etc/apache2/sites-available/your_domain_or_ip.conf

Paste in the following minimal VirtualHost configuration:

/etc/apache2/sites-available/your_domain_or_ip.conf

   ServerName your_domain_or_ip
   DocumentRoot /var/www/your_domain_or_ip

   SSLEngine on
   SSLCertificateFile /etc/ssl/certs/apache-selfsigned.crt
   SSLCertificateKeyFile /etc/ssl/private/apache-selfsigned.key

Be sure to update the ServerName line to however you intend to address your server. This can be a hostname, full domain name, or an IP address. Make sure whatever you choose matches the Common Name you chose when making the certificate.

The remaining lines specify a DocumentRoot directory to serve files from, and the SSL options needed to point Apache to our newly-created certificate and key.

Now let’s create our DocumentRoot and put an HTML file in it just for testing purposes:

$ sudo mkdir /var/www/your_domain_or_ip

Open a new index.html file with your text editor:

$ sudo nano /var/www/your_domain_or_ip/index.html

Paste the following into the blank file:

/var/www/your_domain_or_ip/index.html

it worked!

This is not a full HTML file, of course, but browsers are lenient and it will be enough to verify our configuration.

Save and close the file
Next, we need to enable the configuration file with the a2ensite tool:

$ sudo a2ensite your_domain_or_ip.conf

Next, let’s test for configuration errors:

$ sudo apache2ctl configtest

If everything is successful, you will get a result that looks like this:

Output
AH00558: apache2: Could not reliably determine the server's fully qualified domain name, using 127.0.1.1. Set the 'ServerName' directive globally to suppress this message
Syntax OK

The first line is a message telling you that the ServerName directive is not set globally. If you want to get rid of that message, you can set ServerName to your server’s domain name or IP address in /etc/apache2/apache2.conf. This is optional as the message will do no harm.

If your output has Syntax OK in it, your configuration file has no syntax errors. We can safely reload Apache to implement our changes:

$ sudo systemctl reload apache2

Now load your site in a browser, being sure to use https:// at the beginning.

You should see an error. This is normal for a self-signed certificate! The browser is warning you that it can’t verify the identity of the server, because our certificate is not signed by any of its known certificate authorities. For testing purposes and personal use this can be fine. You should be able to click through to advanced or more information and choose to proceed.

After you do so, your browser will load the it worked! message.

Note: if your browser doesn’t connect at all to the server, make sure your connection isn’t being blocked by a firewall. If you are using ufw, the following commands will open ports 80 and 443:

$ sudo ufw allow "Apache Full"

Next we will add another VirtualHost section to our configuration to serve plain HTTP requests and redirect them to HTTPS.

Step 4 — Redirecting HTTP to HTTPS
Currently, our configuration will only respond to HTTPS requests on port 443. It is good practice to also respond on port 80, even if you want to force all traffic to be encrypted. Let’s set up a VirtualHost to respond to these unencrypted requests and redirect them to HTTPS.

Open the same Apache configuration file we started in previous steps:

$ sudo nano /etc/apache2/sites-available/your_domain_or_ip.conf

At the bottom, create another VirtualHost block to match requests on port 80. Use the ServerName directive to again match your domain name or IP address. Then, use Redirect to match any requests and send them to the SSL VirtualHost. Make sure to include the trailing slash:

/etc/apache2/sites-available/your_domain_or_ip.conf

    ServerName your_domain_or_ip
    Redirect / https://your_domain_or_ip/

Save and close this file when you are finished, then test your configuration syntax again, and reload Apache:

$ sudo apachectl configtest
$ sudo systemctl reload apache2

You can test the new redirect functionality by visiting your site with plain http:// in front of the address. You should be redirected to https:// automatically.

Conclusion
You have now configured Apache to serve encrypted requests using a self-signed SSL certificate, and to redirect unencrypted HTTP requests to HTTPS.

If you are planning on using SSL for a public website, you should look into purchasing a domain name and using a widely supported certificate authority such as Let’s Encrypt.

For more information on using Let’s Encrypt with Apache, please read our How To Secure Apache with Let’s Encrypt on Ubuntu 20.04 tutorial.